
Avista Corp (NYSE: AVA) currently pays a dividend yield of 2.9% which is below the Utilities sector median of 3.4%. While this makes the total return potential for Avista look uninviting, investors may change their mind when analyzing the company's future dividends. In this article, I calculate Avista's fair value by forecasting its dividend distributions and discounting them back to today's value.
Valuation Methodologies Are Not Made Equally
The Dividend Discount Model (DDM) estimates the value of a company's stock price based on the theory that its worth is equal to the sum of the present value of its future dividend payments to shareholders.
But how do we know if it's appropriate to use a dividend discount analysis when estimating the fair value of Avista? Many analysts find it difficult when trying to figure out the correct valuation methodology for a given company or are biased towards one specific approach. This is often a mistake which can negatively impact investment decisions and result in trading losses or missed opportunities. No two companies are the same and every business consists of unique characteristics that may require you to adjust your analysis.
Understanding leverage trends is the first step when determining what valuation analyses are relevant for a given company. When a company's leverage doesn’t fluctuate or is expected to remain stable over time, then an equity valuation model (e.g. equity DCF, DDM) will be the most appropriate valuation technique. The reason for this is because when leverage is stable, interest expense on debt can typically be projected with much more reliability.
How do we check if a company's leverage has been fluctuating or is expected to do so? This isn't always straightforward but checking recent debt ratio trends can be a good indicator. Avista's debt to equity ratio has been relatively stable over last few years ranging from 111.3% to 113.2%. This suggests that an equity valuation model is a suitable technique when valuing the company's shares. Now does it make sense to use a dividend discount model knowing that an equity valuation technique is an appropriate methodology?
The next step is to figure out if Avista pays a dividend and if so, is its payout ratio relatively high (typically above 75%)? The table below highlights this information.
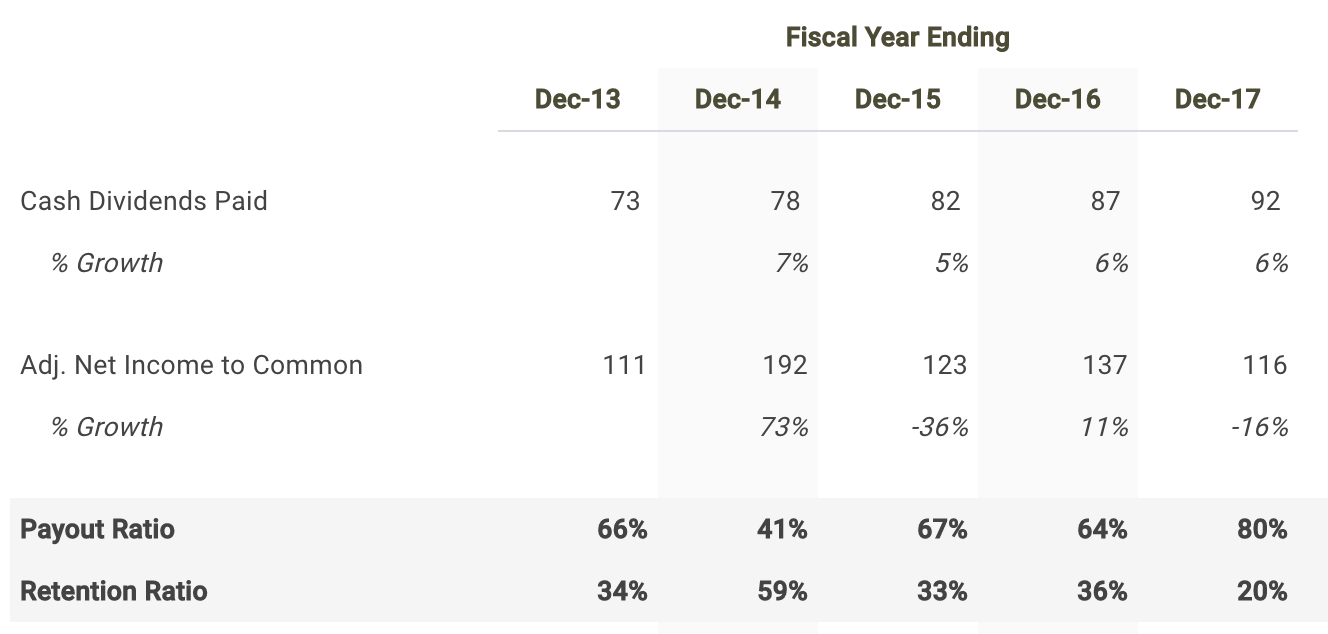
Source: Avista dividend discount model
Avista distributed a total of $92 million in cash dividends to shareholders in its most recent fiscal year Dec-17 which represented a payout ratio of 79.8%. It appears that the company meets both criteria. Therefore, it is fitting to use a dividend discount model when determining the fair value of Avista stock.
Forecasting Avista's Dividends
The first step in building a dividend discount model is to forecast net income since forecasting dividends directly can be difficult. So let's create a net income forecast for the next five years and use that as the basis for projecting future dividends.
As of April 5, Wall Street analysts are projecting a mediocre growth rate in the company's bottom-line over the next five years. Net income is expected to reach $179 million by fiscal year 2022.
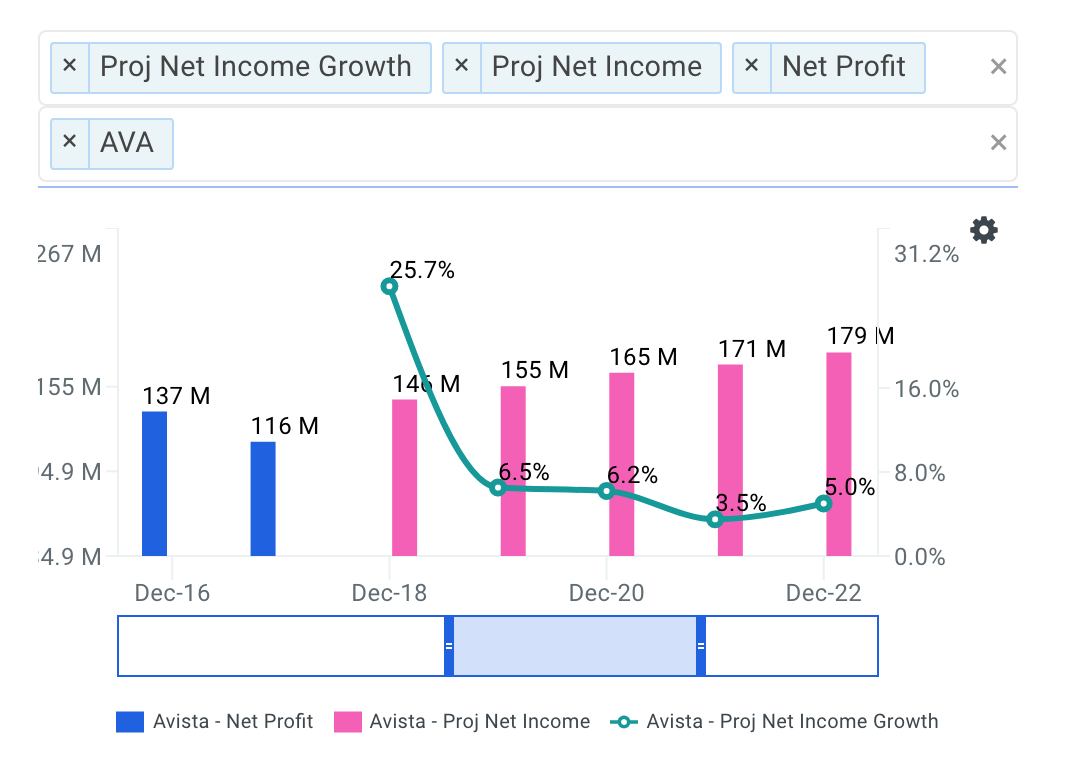
Source: Avista Projected Net Income Growth
I use the net income projections above to serve as the basis for my dividend forecast. The next step is to forecast the payout ratio where I selected 66.0% for the next fiscal year which is in line with historical levels.
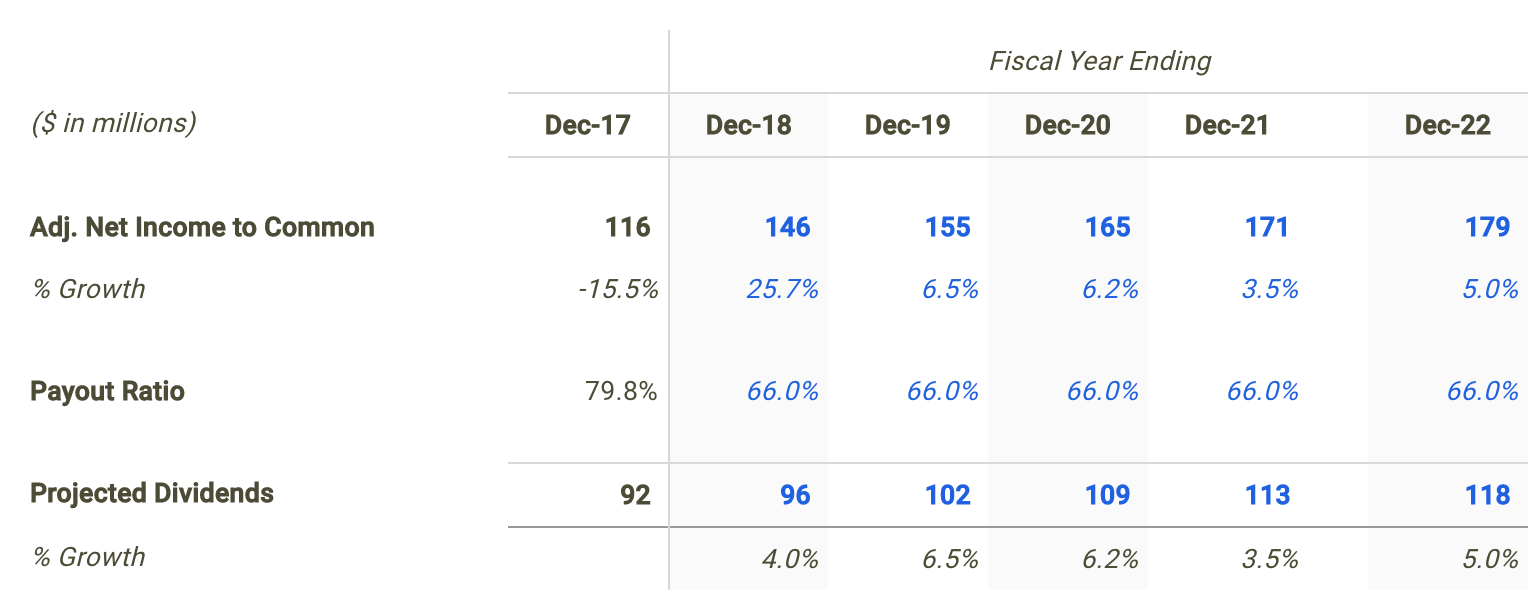
Source: Avista dividend discount model
Calculating Avista's Fair Value
The last step is to select a discount rate to calculate the present value of the forecasted dividends. I used finbox.io’s Weighted Average Cost of Capital (WACC) model to help arrive at an estimate for the company's cost of equity.
I determined a reasonable discount rate for Avista to be 9.6% at the midpoint. An updated cost of capital analysis using real-time data can be found at finbox.io's Avista WACC model page.
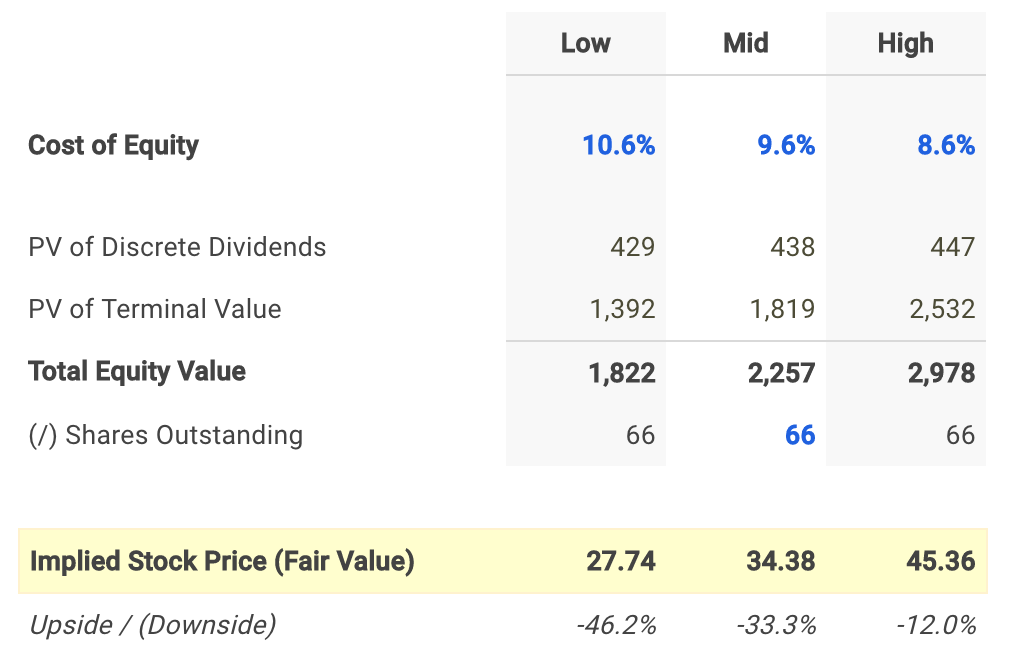
The assumptions used in the dividend discount model calculate a fair value per share for Avista of $34.38, -33.3% below its current stock price of $51.55. Therefore, AVA appears to be an overvalued stock and not necessarily a good entry point opportunity.
Conclusion: Dividends Don't Support Stock Price
Discovering the fair value of a company can sometimes be difficult. However, determining an appropriate valuation methodology should not be. Knowing when and when not to use the dividend discount model will help in your investment decision making process.
However, it's important to understand that a dividend discount model will inherently undervalue a stock. This is typically the result of the payout ratio assumption being less than 100% implying some cash leakage. Meaning the approach does not capture value that would otherwise build up as cash on the balance sheet. In practice, this excess retained cash is usually paid out to shareholders as special dividends or to make up for cash shortfalls for future dividends during economic downturns.
This helps explain, at least partially, why Avista looks like an overvalued stock based on this approach. Nevertheless, a dividend discount analysis is still a helpful tool in combination with the understanding that it calculates a conservative intrinsic value estimate. Meaning an extremely attractive opportunity would be a stock where (1) a dividend discount model is appropriate and (2) shares looks undervalued based on its future dividends.
Note that there are a number of fundamental factors I have not considered in this analysis. I recommend that you continue your research on Avista to gain a better understanding of its future prospects.
Author: Matt Hogan
Expertise: Valuation, financial statement analysis
Matt Hogan is also a co-founder of finbox.io. His expertise is in investment decision making. Prior to finbox.io, Matt worked for an investment banking group providing fairness opinions in connection to stock acquisitions. He spent much of his time building valuation models to help clients determine an asset’s fair value. He believes that these same valuation models should be used by all investors before buying or selling a stock.
His work is frequently published at InvestorPlace, Benzinga, ValueWalk, AAII, Barron's, Seeking Alpha and investing.com.
Matt can be reached at [email protected].
As of this writing, I did not hold a position in any of the aforementioned securities and this is not a buy or sell recommendation on any security mentioned.


%20Dividend%20Yield%20Looks%20Unattractive)