- Acquisition of Virgin America instantly delivers hard-to-enter new markets.
- Premium value strategy paying off with $25 billion Leisure Enthusiast market.
- Wall Street analysts and my valuation models agree on potential stock price appreciation.
Record-Setting Air Travel
Since the end of the last recession, air travel has regained its mojo. A strong economy, low fuel prices, and lower ticket prices have driven robust growth. Retiring Baby Boomers and social media peer pressure for one-upping vacation pictures also helps as air travel metrics have been setting records.
In the most recent industry data available from November 2017, Domestic Revenue Passenger Miles (RPM) reached an all-time high in the U.S. RPM is a traditional airline industry metric of paying passengers multiplied by their miles flown.
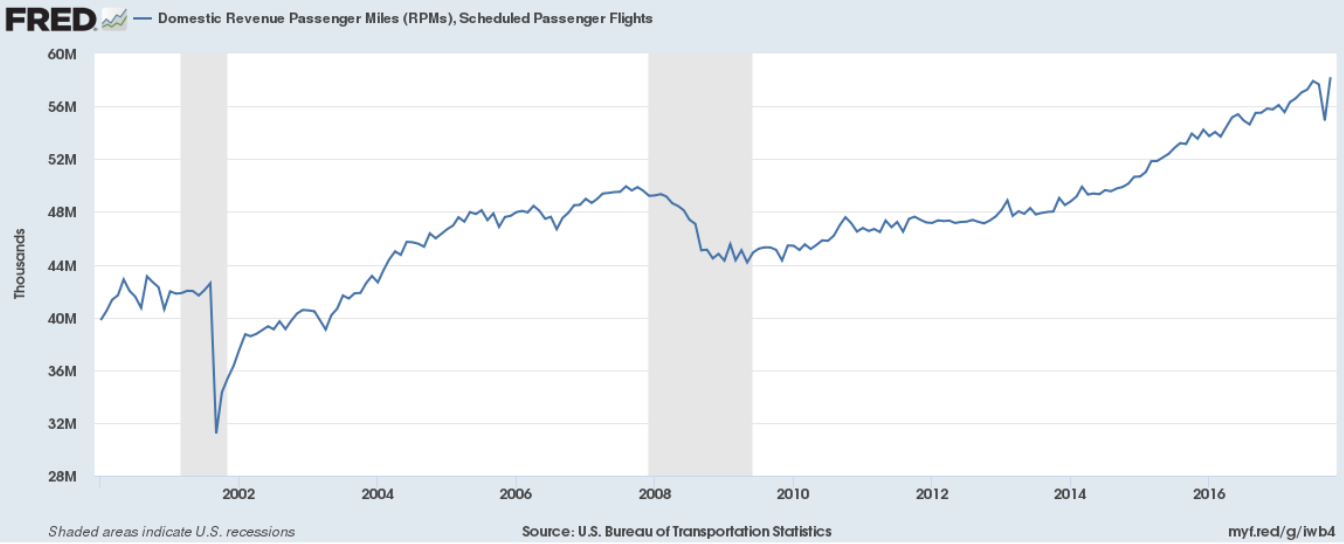
Source: U.S. Bureau of Transportation Statistics, Note: BTS indicates Sept. 2017 dip due to hurricanes in southern U.S.
What is helping drive the RPMs is the record-breaking number of travelers (chart below) as lower prices have helped bring in customers. Inflation-adjusted ticket prices fell 3.9% in 2015 and 8.5% in 2016. Last month, the Bureau of Traffic Statistics (BTS) reported that the average domestic air fare decreased to $336 in the third quarter of 2017, the lowest inflation-adjusted quarterly fare in 23 years of air fare records.
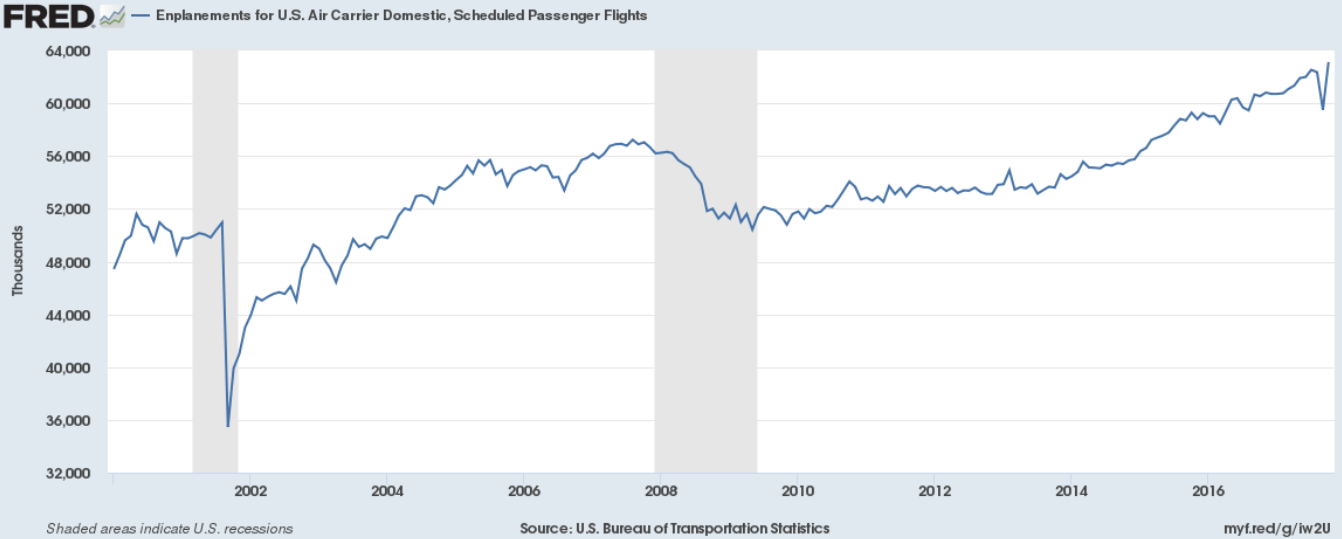
Source: U.S. Bureau of Transportation Statistics, Note: BTS indicates Sept. 2017 dip due to hurricanes in southern U.S.
The rise of ancillary fees, such as baggage fees, has helped keep pure ticket prices down. As the BTS noted in its report on fares: In recent years, airlines have obtained additional revenue from fees charged to passengers, as well as from other sources. U.S. passenger airlines collected 75.0 percent of their total revenue from passenger fares during the third quarter of 2017, down from 87.6 percent in 1995.
Airlines must walk a tight rope when trying to balance increased passenger counts with the cost of increasing fleet size. The industry metric of load factor shows that airlines have been running much leaner operations since the twin hits of the 2001 terrorist attacks and recession. Utilization has risen to 85%, and remained near that level since 2012. The industry appears to be managing its capacity wisely.

Source: U.S. Bureau of Transportation Statistics, Note: BTS indicates Sept. 2017 dip due to hurricanes in southern U.S.
The airline industry is notorious for its cyclical ups and downs. We are currently in the upswing of the business cycle, which puts investors in a precarious position. It is important to ascertain whether an airline can profit from a boom, but also be disciplined enough to survive the bust. Alaska Air Group’s (NYSE: ALK) recent acquisition of Virgin America, its focus on flexible expansion, and a “fortress” balance sheet indicate a strongly positioned airline.
Company Overview
Source: finbox.io
Alaska Air Group is a mostly domestic provider, serving 115 destinations plus Mexico, Canada, and Costa Rica. Airlines can generally be categorized as network, low-cost carriers (LCC), and ultra low-cost carriers (ULCC). The graphic below from Alaska Air provides a good overview of who fits where, but also adds a more nuanced category. The lower cost carriers can often conjure up images of cattle calls and coin-operated bathrooms, but airlines in this Premium Value category deliver an enhanced product while still being price competitive with the LCCs. Although the graphic indicates the most seat growth has been in the Premium Value area, these airlines are generally smaller, and operate in the shadow of LCC giant Southwest Airlines (NYSE: LUV).
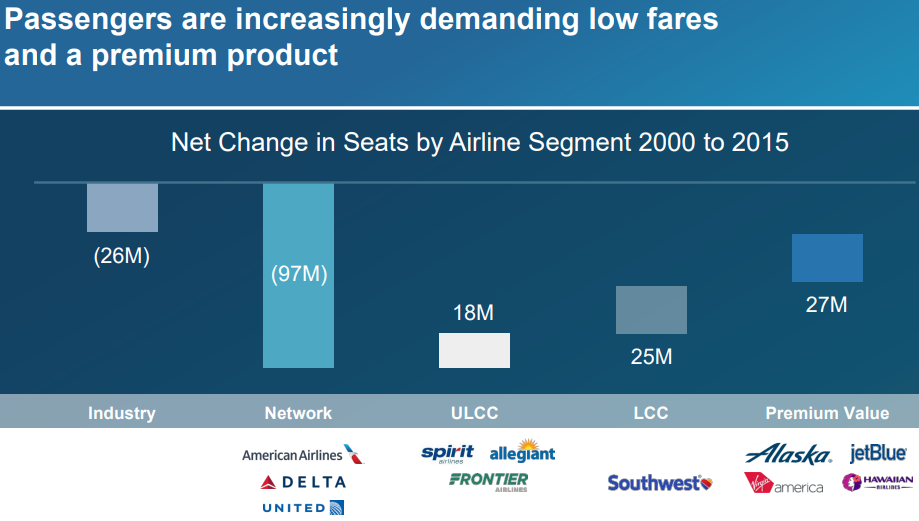
Source: Alaska Air 2017 Investor Day Presentation
David v. Goliath
According to the BTS’ most recent data (table below), Alaska Air ranks as the sixth or seventh largest airline in the U.S. by market share and passengers. Southwest ranks first. Alaska Air’s $8 billion market cap ranks fifth compared to its peers; dwarfed by Southwest, which weighs in at $34 billion. The other Premium Value airlines are all smaller, ranging from $2 to $6.5 billion. In order to compete with Southwest, and keep ahead of its Premium Value peers, Alaska Air has been expanding into new customer segments and markets.
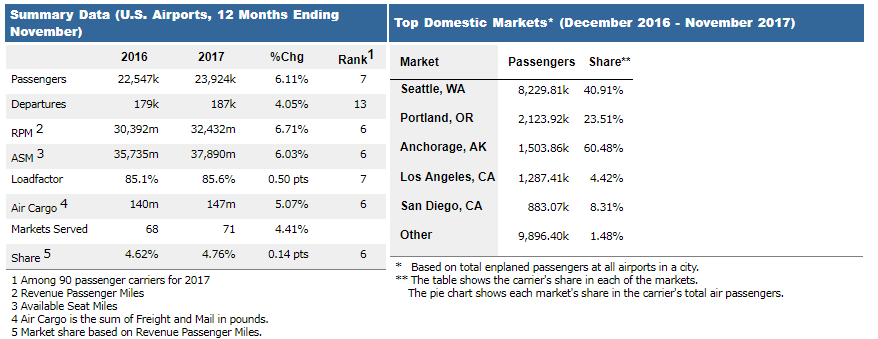
Source: Bureau of Transportation Statistics
Premium Value Strategy
Beyond budget travelers, the firm has been targeting the Leisure Enthusiast segment, which they peg as a $25 billion market. The acquisition of youthful Virgin America at the end of 2016 was an opening salvo in penetrating this image-conscious group, who they expect will pay for premium features.
Management is working to fuse the trendy Virgin America vibe and Alaska Air’s professional image to further the Premium Value profile. The airline is committed to improving the travel experience by adding music to airport lounges and waiting areas, blue mood lighting inflight, connectivity/entertainment upgrades, and catering to different lifestyles with premium healthy food choices.
To further entice the Leisure Enthusiast, the company reduced fees on oversized sporting equipment in 2017. Passengers will pay only $25 to bring a surfboard, mountain bike or golf clubs along.
Virgin Air Acquisition
The acquisition of Virgin America was a logical play for Alaska Air, whose footprint was mostly in the Pacific Northwest. California has more than triple the population of Alaska, Washington, and Oregon combined, and more than double the number of fliers. This was not an acquisition that would swallow up a direct competitor to improve market share and cost efficiencies. Instead, there was so little overlap, that there were no related layoffs. The complementary nature of the merger provided Alaska Air immediate access to a major new market that is difficult to penetrate.
Fortress Balance Sheet
At the last Investor Day, CFO Brandon Pedersen highlighted the company’s low costs, high margins, and fortress balance sheet. He claimed that these lower costs, relative to other LCCs, generate a $900 million advantage in pretax profits. This cost discipline is one aspect of what creates the proverbial fortress balance sheet, a phrase indicating that a company is prepared to weather economic shocks.
The company is also focused on decreasing its debt load. It reduced long-term debt by nearly $400 million, or 14%, in 2017. Aiding this effort is the ability to fund nearly all capital expenditures from cash flow.
Flexible Fleet Expansion
Maintaining and growing a fleet of airplanes requires long-term planning and measured deployment of capital. The graphic below indicates Alaska Air’s use of aircraft options, which guarantees their place in the manufacturing queue but do not oblige the airline to purchase the plane.
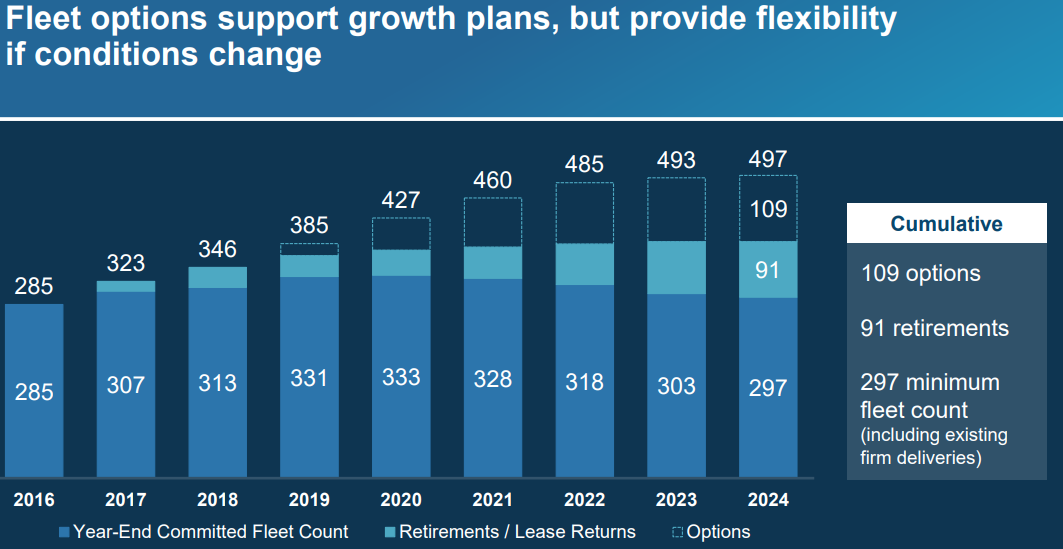
Source: Alaska Air 2017 Investor Day Presentation
Alaska Air Group is in the midst of a fleet review, so the strategy shown above could change. CAPA notes that the merger has complicated planning, as Alaska Air owns 93% of its planes (all Boeing), but inherited a fleet from Virgin America that are predominantly leased Airbus aircrafts. Alaska Air also inherited Virgin America’s orders, and it could take years to get to the optimal fleet.
Is Alaska Air Cleared for 20% Upside?
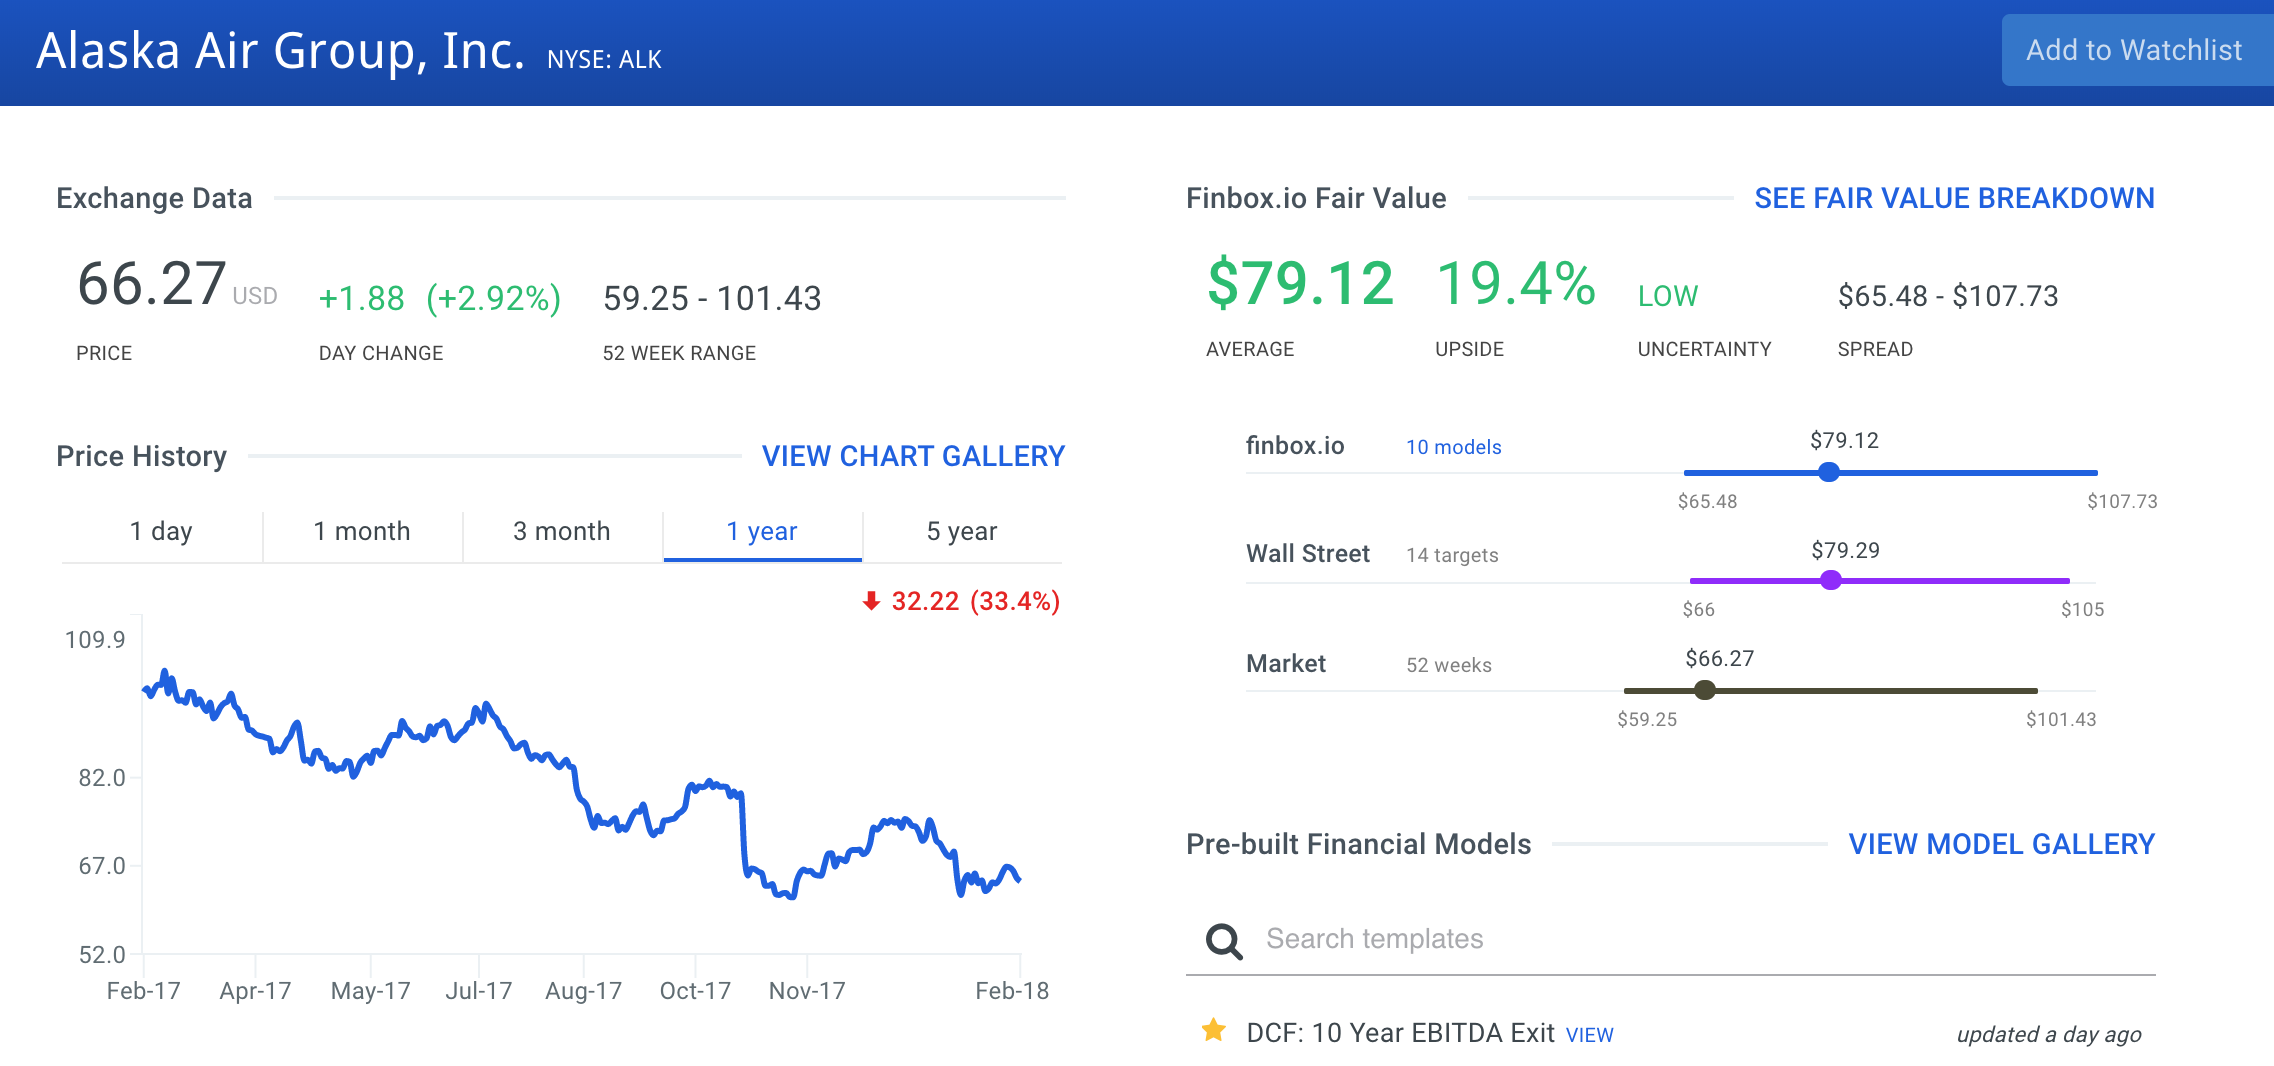
Source: finbox.io
Finbox.io’s dashboard helps provide an overall view of a stock. In the Fair Value section, the site presents a proprietary quant-based stock price target along with Wall Street’s target. Both measures predict approximately 20% upside for the stock.
Peer analysis for this Premium Value airline requires a little customization. The default peers listed on finbox.io’s dashboard include Chinese and German airlines which many analysts prefer to use. However, I preferred a different comp set and easily replaced these with other U.S. based low-cost companies.
Alaska Air’s management often boasts about their margins and rightfully so. Management has delivered against this set of peers. ALK does have the best pre-tax margins amongst this mix of network, low/ultra low-cost, and Premium Value carriers. Southwest has the highest net margin at 16.5%, followed by ultra low-cost Allegiant (Nasdaq: ALGT) which bests Alaska Air by a mere 20 basis points.
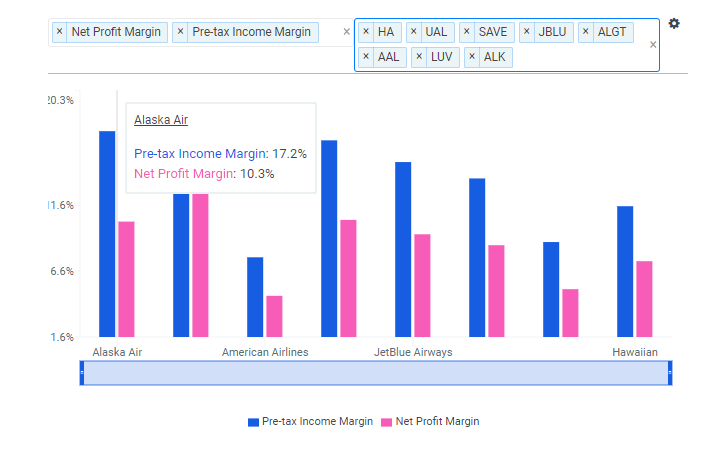
Source: finbox.io
A look into leverage is necessary for an airline. As noted earlier, the company has been working to bring debt down, and in 2017 had reduced it by 14%. The airline compares favorably to its peers in its ability to pay interest on its debt with EBIT covering interest of 13.5x. The only better peer was Southwest.
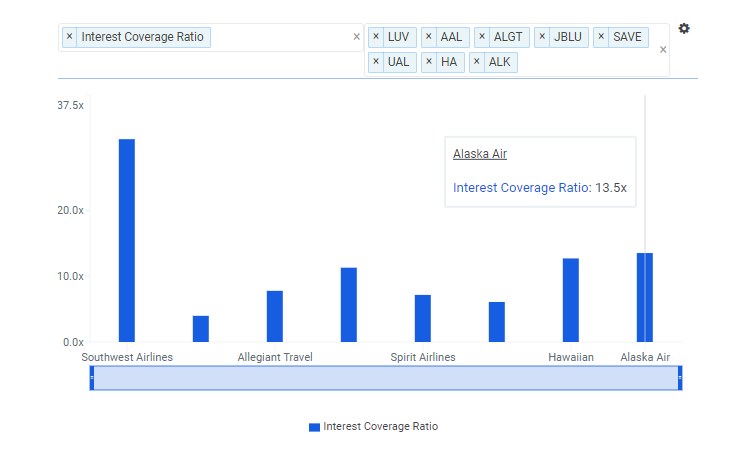
Source: finbox.io
The fact that Alaska Air can pay the cost of its debt comfortably is a plus but the other question is just how leveraged are they? Compared to the group, they employ an average amount of financial leverage. ALK’s 77.4% debt/equity ratio is fourth lowest among its peers. A direct competitor, Jet Blue (Nasdaq: JBLU), has the lowest leverage followed by Southwest.
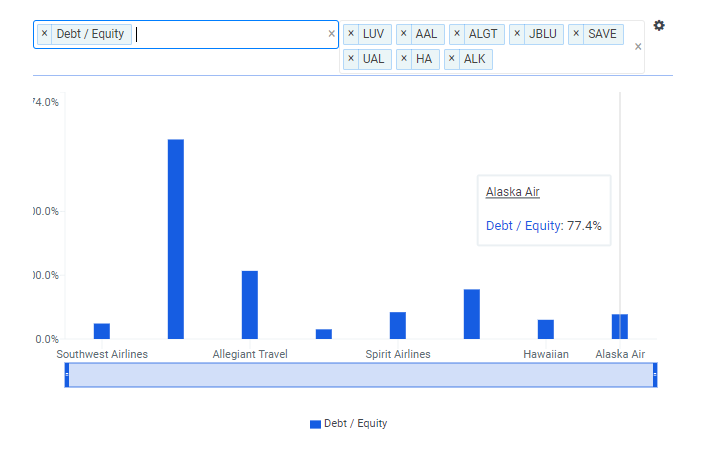
Source: finbox.io
With no red flags so far, it is helpful to look at price and cash flow measurements to see how the market is valuing the stock. Since earnings can be manipulated or engineered by management, price/sales is a good check. The lower the price multiple compared to peers, the more likely that a stock is relatively underpriced. Alaska Air’s P/E of 10.3x is inline with its Premium Value brethren and all the peers in general. Sales is a purer metric for comparison, but obviously ignores the potential value of a higher margin company. In this case, the group’s P/S ratio averages out to 1.05x, but most of the peers are huddled around 1.0x, so just like its P/E, ALK is inline. Neither of these multiples indicate the firm is underpriced compared to its peers.
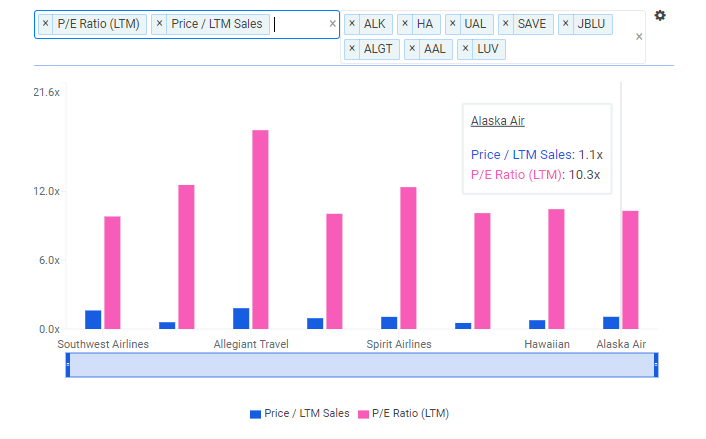
Source: finbox.io
Enterprise Value/Free Cash Flow is another helpful metric and is historically a good indicator of valuation. It takes the theoretical cost to purchase the firm, factoring in market cap, debt, and cash, and divides it by dollars left over for shareholders. One note that shows the honesty of this multiple is that American, Spirit, and United had to be removed due to negative cash flow. Compared to its Premium Value peers, Alaska Air’s 16.8x is quite low.
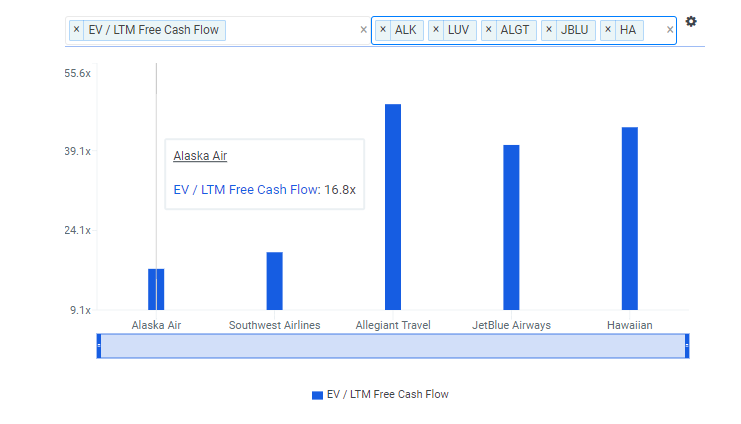
Source: finbox.io
Alaska Air Group Conclusion: Ready to Ascend 20%
Management looks to have staged the company to take advantage of the good times as well as handle the bad times. Its acquisition of Virgin America was a great step to buy growth in a way that is not as risky as doubling down on existing routes. In addition to growth, Virgin America also has helped the company revamp its style and penetrate the more upscale Leisure Enthusiast market. In improving ambiance, providing healthy meal options, and cutting fees on traveling with larger sports gear like surfboards, Alaska Air is catering to the West Coast lifestyle.
Wall Street has bought into management’s road map, and finbox.io’s valuation models provide confirmation.
Author: Matt Hogan
Expertise: Valuation, financial statement analysis
Matt Hogan is a co-founder of finbox.io. His expertise is in investment decision making. Prior to finbox.io, Matt worked for an investment banking group providing fairness opinions in connection to stock acquisitions. He spent much of his time building valuation models to help clients determine an asset’s fair value. He believes that these same valuation models should be used by all investors before buying or selling a stock.
His work is frequently published at InvestorPlace, Benzinga, ValueWalk, AAII, Barron's, Seeking Alpha and investing.com.
Matt can be reached at [email protected].
As of this writing, I did not hold a position in any of the aforementioned securities and this is not a buy or sell recommendation on any security mentioned.


