
Using the Stock Screener
Why screen for stocks?
There is a lot of information out there. How are you ever supposed to sift through the noise?
You're in luck! finbox.io's powerful screener is here to help. Want a list of companies with nice dividend yields and good fundamentals? We got you! How about stocks that are trading below their intrinsic value? Here you go. We even give you ability to download all the matches to Excel and look through them there.
Now that's REAL Power
Here is an outline of the basics we'll cover here:
- Adding Filters
- Updating Filters
- Adding Columns
- Sorting Results
- Downloading Results
- Saving Screens
- Examples
Adding Filters
Filters allow you to specify criteria that we can use to match companies. Click the + Update Filters button in the left panel:
Click on the metrics that you would you like to use in your screen:
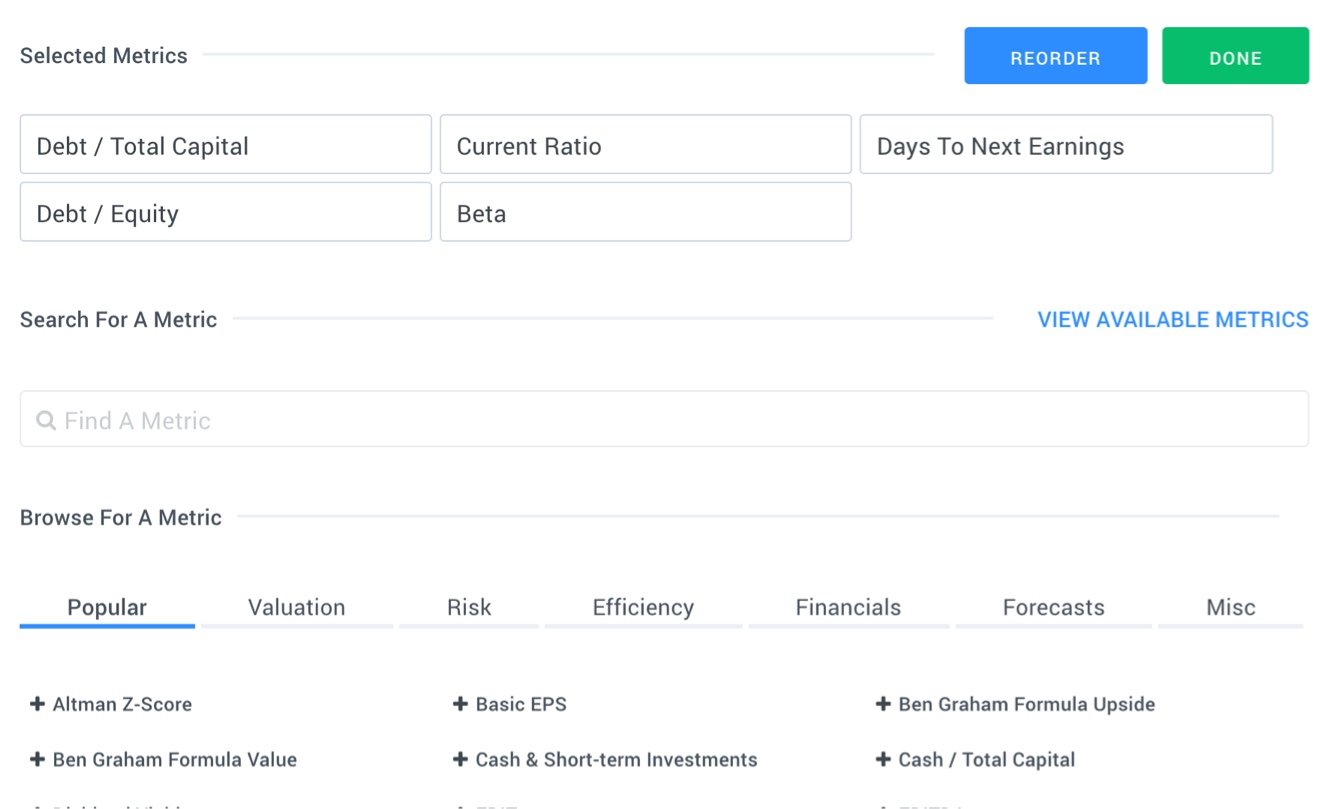
We've organized metrics in the following categories:
Valuation: Market data and fair value related metrics. This tab is a good place to find metrics that indicate how cheap or expensive a stock may be. Example metrics include valuation multiples like EV/EBITDA and P/E ratio and fair value indicators like Upside (Analyst Target) and Upside (finbox.io).
Risk: Debt and credit quality related metrics. Do you only want stocks with low risk of bankruptcy? Add filters like Debt / Total Capital and Altman Z-Score to your screen.
Efficiency: How efficiently does management convert capital into value for you? You'll find metrics here like Asset Turnover, Return on Invested Capital, and Profit Margin.
Financials: Financials from the income statement, balance sheet and cash flow statement. You'll find metrics related to size like Total Revenue and Total Assets as well growth metrics like Revenue CAGR (7y) and EPS CAGR (3y) here.
Forecasts: We know about the past, but what about the future? Under this tab you'll find forecasts for Revenue and EPS as well as computed growth metrics like Proj Revenue CAGR (10y) and Proj EBITDA CAGR (10y).
Updating Filters
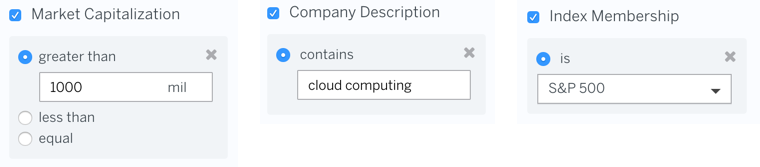
Once you've selected the filters you would like to use in your screen, it's time to specify the thresholds. For example, to screen for companies that have Market Cap greater than $1 billion, have cloud computing in the business Description, and are part of the S&P 500 Index, your filters should look like this:
Adding Columns
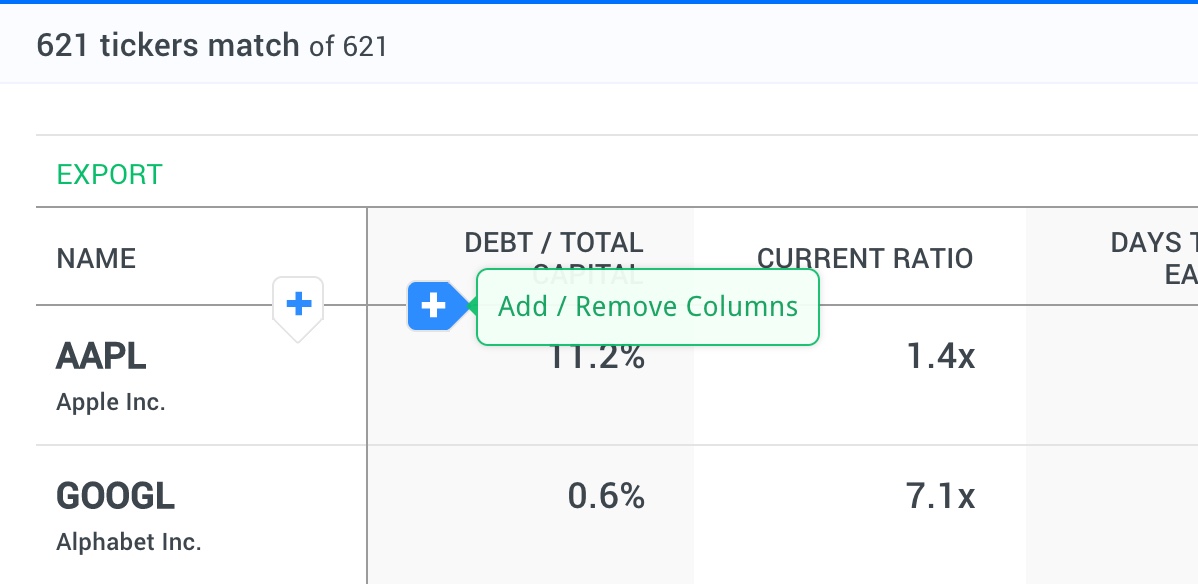
To get more information on the results that match your criteria, you can add columns. Any of the metrics discussed above can also be used as columns. Click the Columns button to bring up the Columns Editor and select the fields you would like to add to your screen:
Sorting Results
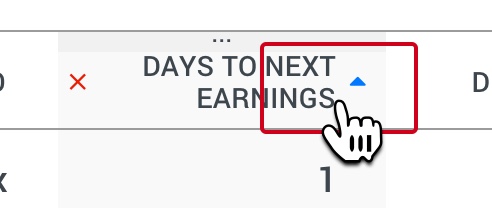
To bring the best results to the top, sort your results by clicking the column header of the column you would like to sort by:
We automatically calculate a stock price index based on the first ten results to give you a sense of how the companies in your screen have performed in the past.
Downloading Results
To download your results, Click the Download button in the screener header. Your results will export in CSV format.
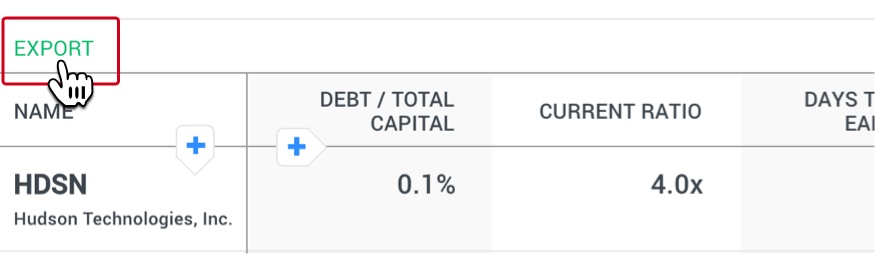
For more information on working with CSV files in Microsoft Office please see Import or export text (.txt or .csv) files.
Saving Screens
Once you've created a screen, you can save the criteria to run again later.
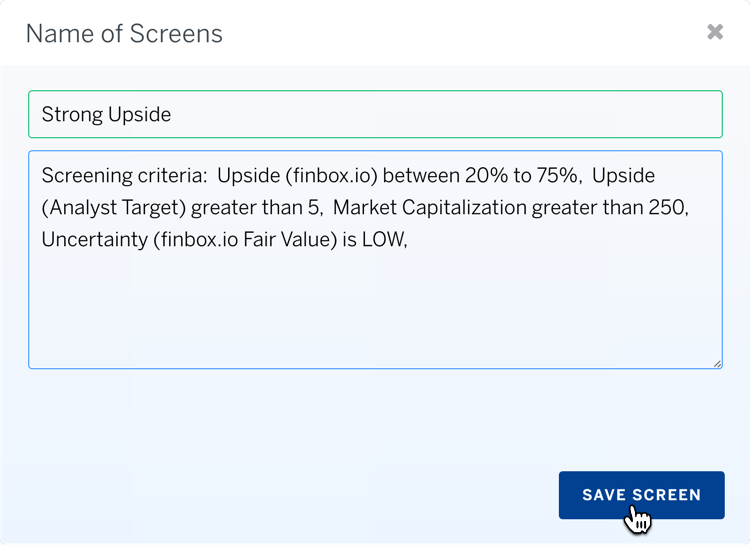
Click the Save button in the upper right corner and a pop-up will ask you for a name and description of the screen:
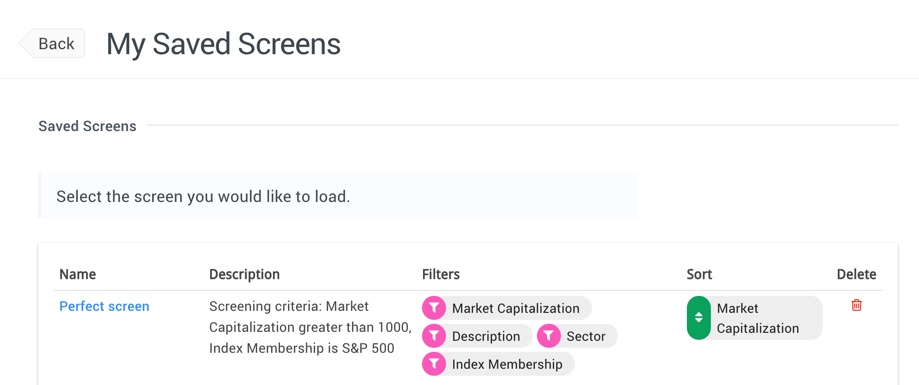
Once you've saved a screen, you can load it again from the Saved Screens pop-up:
Example Screens
To get your creativity flowing, here are some example screens with the explanations of the underlying thought process:

