Summary
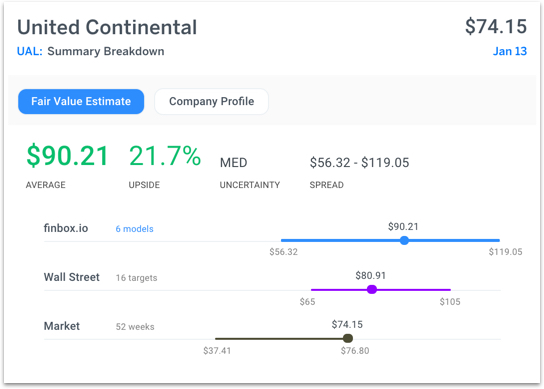
United Continental Holdings (NYSE:UAL) is expected to report earnings Tuesday after the market closes. The company's shares last traded at $74.15 as of Friday, approximately 98% of its 52 week high. Although the stock is near its high, finbox.io fair value data implies that shares are still over 20% undervalued while Wall Street's consensus price target of $80.91 implies nearly 10% upside.
<img src='http://res.cloudinary.com/finbox/image/upload/v1484346609/2_-_UAL_uglehr.jpg' alt= ‘UAL finbox.io fair value estimate’>
Comparable Company Analysis
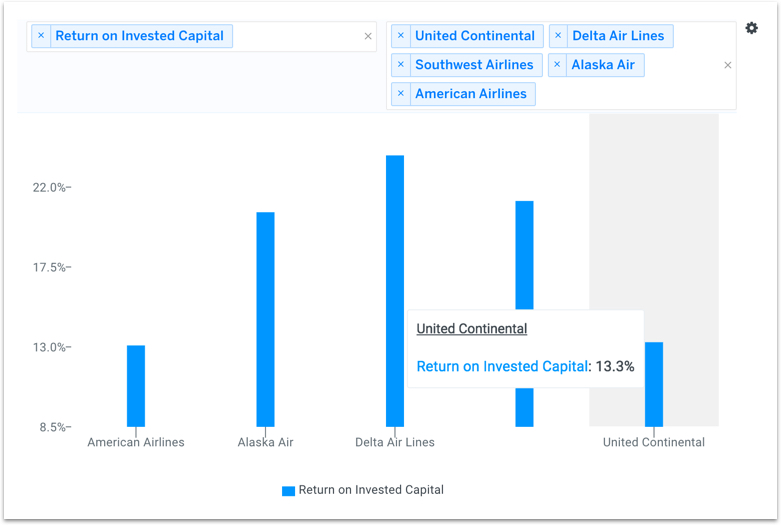
Return on Invested Capital (ROIC) is a metric often used to evaluate the ability of the company to create value for all its stakeholders, debt and equity.
ROIC = NOPAT / Average Invested Capital
NOPAT is defined as Net Operating Profit After Tax and Average Invested Capital is the average Debt + Equity over the same time period.
United's ROIC does not immediately stick out when compared to its publicly traded peer group: Alaska Air Group, Inc. (NYSE:ALK), Delta Air Lines, Inc. (NYSE:DAL), Southwest Airlines Co. (NYSE:LUV) and American Airlines Group Inc. (NasdaqGS:AAL).
The company's ROIC over the prior twelve months of 13.3% is slightly above AAL (13.1%) and below ALK (20.6%), DAL (23.8%), and LUV (21.2%).
<img src='http://res.cloudinary.com/finbox/image/upload/v1484233660/UAL_PEER_ROIC_haijr5.jpg' alt= ‘UAL ROIC chart‘>
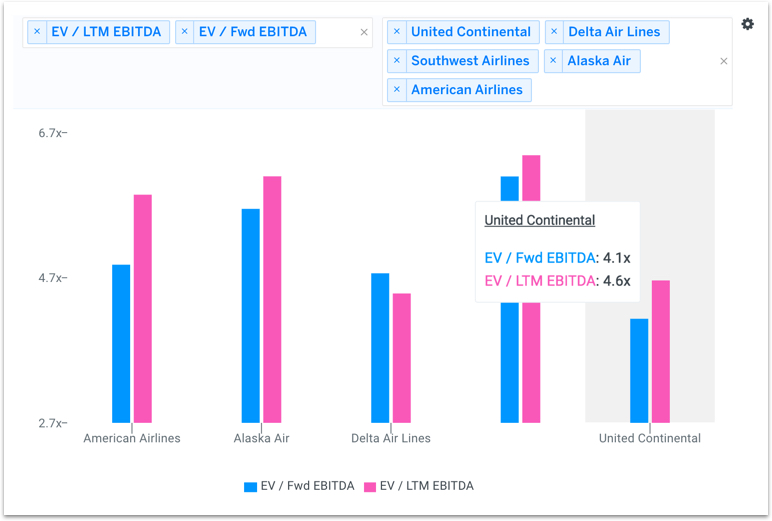
These return figures, in part, help explain why the company's EBITDA multiples trade at a discount to this same comparable company group.
United's forward EBITDA multiple of 4.1x is well below all of its peers: ALK (5.6x), DAL (4.7x), LUV (6.1x), and AAL (4.8x).
<img src='http://res.cloudinary.com/finbox/image/upload/v1484233660/UAL_EBITDA_Multiples_ss4zny.jpg' alt= ‘UAL EBITDA multiples chart‘>
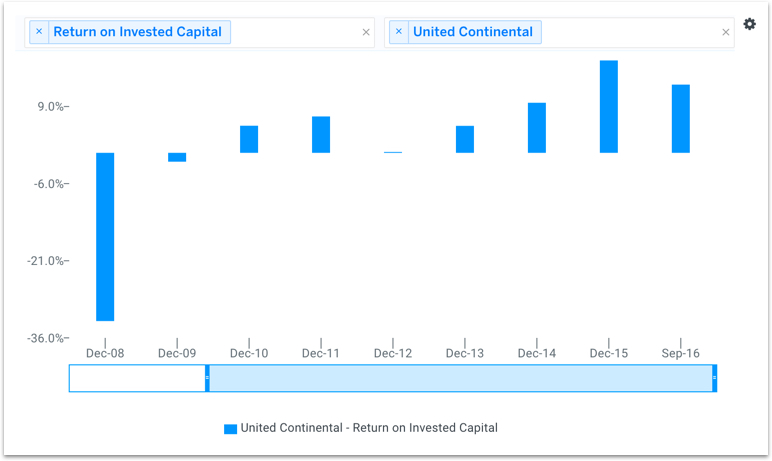
However, note how the airline's returns have generally improved since its 2008 low of -30%. Compare this to United's fiscal year 2015 ROIC of 18% - a big improvement!
<img src='http://res.cloudinary.com/finbox/image/upload/v1484233660/UAL_Historical_ROIC_hunesg.jpg' alt= ‘UAL historical returns chart‘>
The company's financial performance has improved over the last several years and is expected to continue improving.
When inputting consensus Wall Street projections into finbox.io's various discounted cash flow (DCF) analyses and comparable company models, United appears to be fundamentally undervalued.
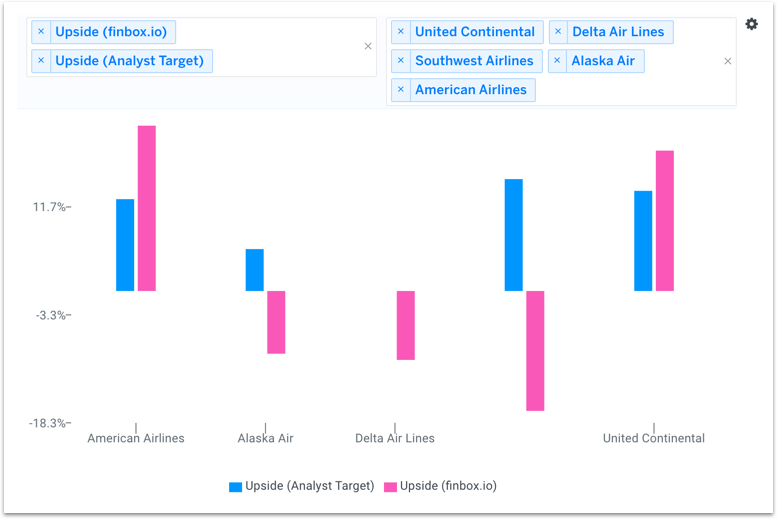
The chart below compares our calculated margin of safety for each peer company vs Wall Street's.
<img src='http://res.cloudinary.com/finbox/image/upload/v1484602420/UAL_Peer_Upside2_f6gtit.jpg' alt= ‘UAL peer group upside analysis chart‘>
Note how Wall Street's generally bullish on this entire airline group. However, our unbiased analyses concludes that only United and American Airlines are materially undervalued.
Furthermore, S&P Capital IQ just reiterated its Buy rating on United and noted its positive fundamental outlook on the US airline industry. The research firm believes that, "valuations across the group are likely to expand in '17, on better unit revenue performance."
But which stock's valuation is positioned to improve the most?
Investors may want to take a closer look at United prior to earnings.
Get Started Now!
Note this is not a buy or sell recommendation on UAL. It is purely an overview of the stock's underlying fundamentals so that investors can come to an informed decision.

