
A new filing with the SEC revealed that Trian Partners sold large quantities of Wendys Co (Nasdaq: WEN) stock on Monday. With shares up 18.8% in the last 3 months, it's worth taking a closer look at the company.
Trian Partners Cuts Wendy's Stake
On February 14th, Nelson Peltz's firm Trian Fund Management filed its quarterly Form 13F regulatory filing. The filing showed that the investment firm held 39,035,921 shares of Wendy's worth $641.0 million as of December 31st.
However, a new filing yesterday revealed that Trian Fund Management sold 5,000,000 shares worth a total of $82.5 million on Monday. This reduced the firm's position in the fast food company by 12.8%.
The stock last traded at $16.26 as of Wednesday, up 18.8% over the last three months. Although Nelson Peltz still holds a large number of shares, could his firm's recent selling activity signal that the stock is overvalued?
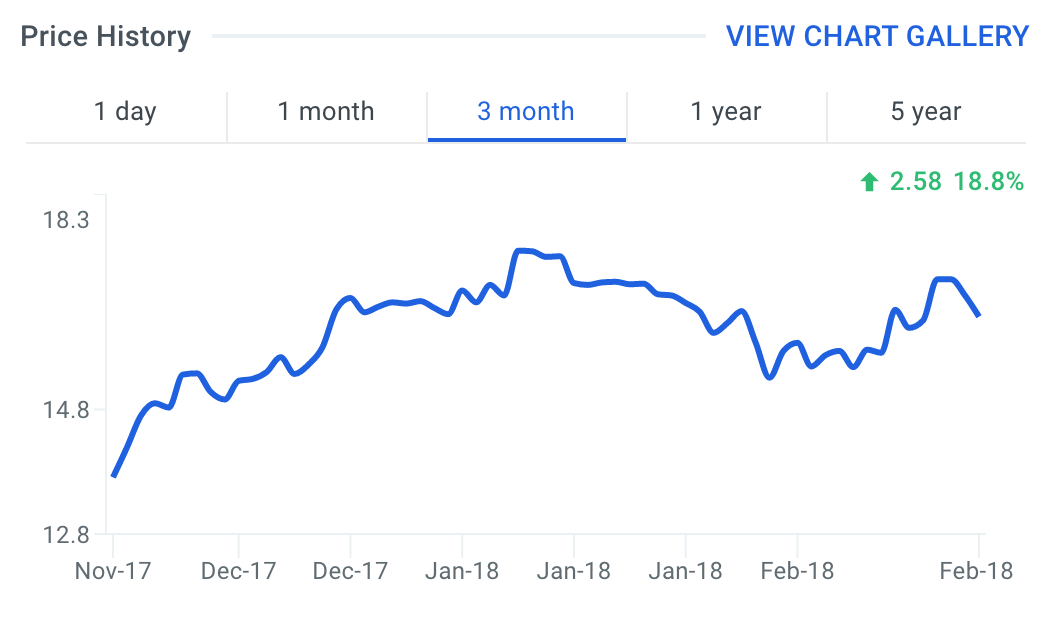
source: finbox.io
Is Wendy's Overvalued?
Wendy's operates as a quick-service restaurant company worldwide. Analyzing Wendy's valuation metrics and ratios offers insight into why Trian may be reducing its stake.
Analysts often look at companies as either thriving, surviving or dying. Analyzing a company's EBITDA growth can help distinguish between these stages. EBITDA growth compares a company's EBITDA from the most recent year (or quarter) to its EBITDA from the previous year (or quarter). Growth trends can typically signify whether the core business is doing well or not.
On a quarterly basis, Wendy's EBITDA growth has ranged from -40.3% to 45.7% over the previous six quarters. However, notice how growth has been trending lower in the chart below. This is generally not what investors like to see.
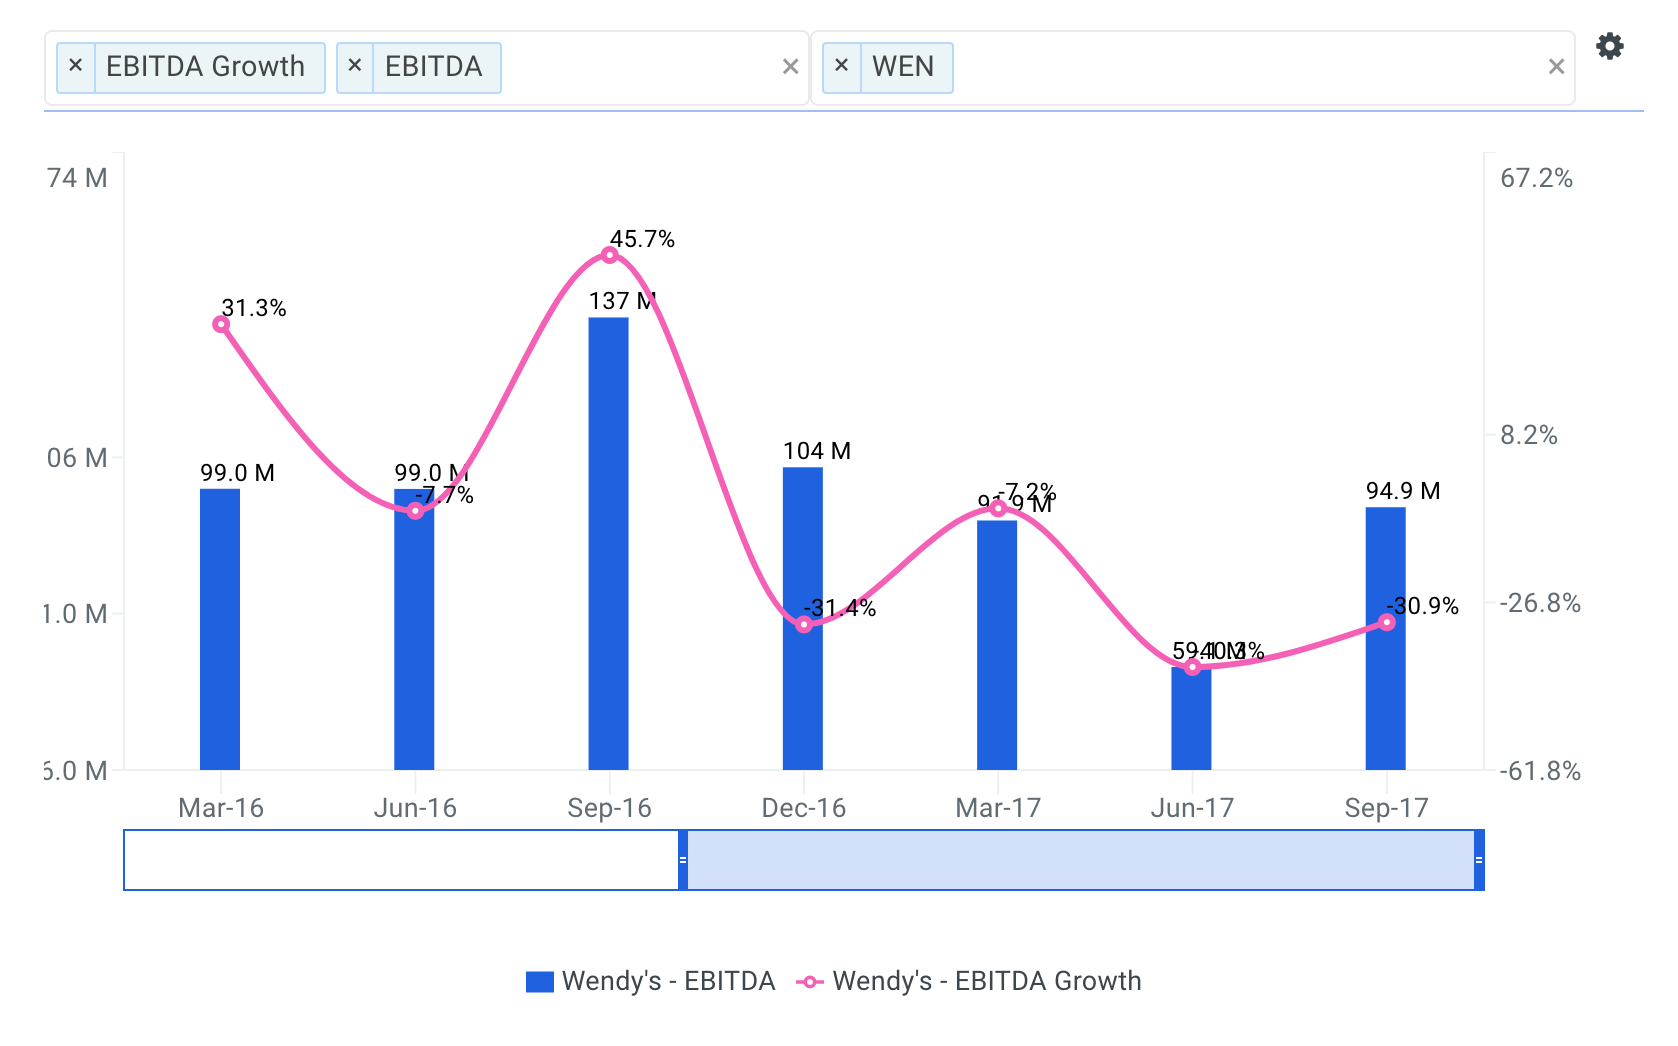
source: finbox.io
Return on Invested Capital (ROIC) is used to evaluate the ability of a company to create value for all its stakeholders, debt and equity. The company's ROIC of 5.5% is below all of its selected comparable public companies: CMG (15.1%), DPZ (110.9%), YUM (28.7%) and MCD (29.2%).
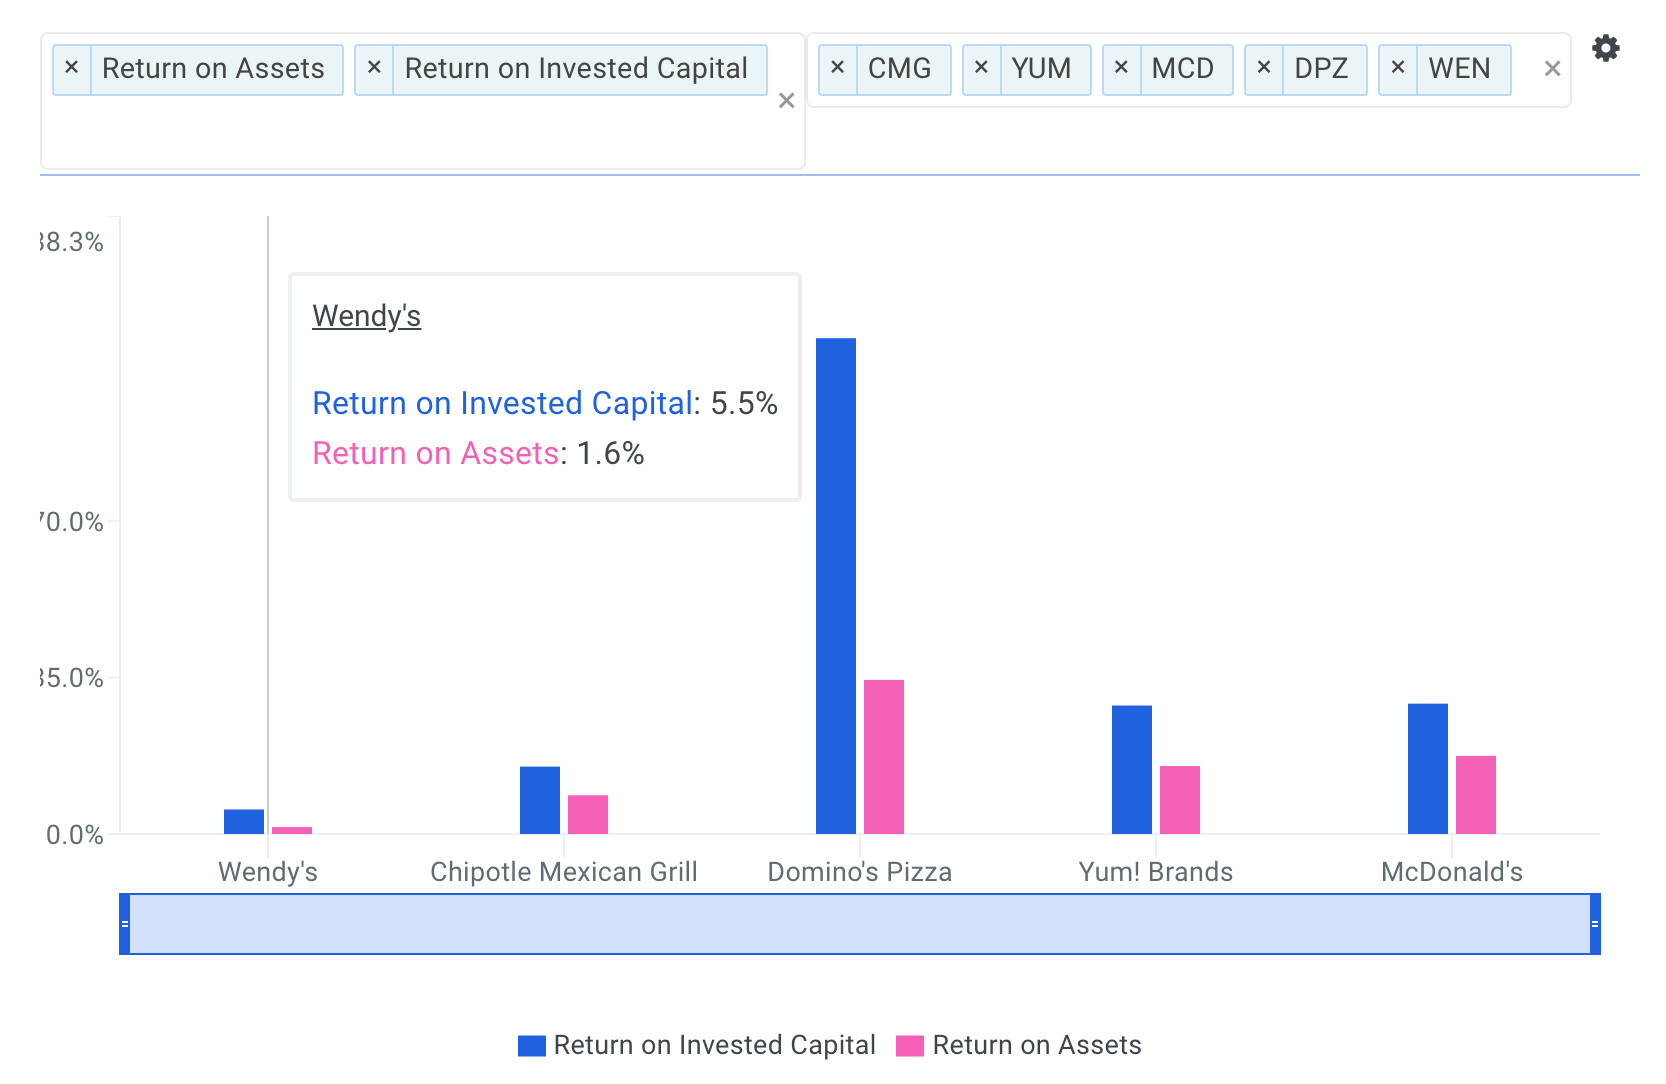
source: finbox.io
Another helpful metric is Return on Assets (ROA) which represents the dollars in earnings or Net Income a company generates per dollar of assets. ROA is typically used to gauge the efficiency of the company and its management at deploying capital to generate income for shareholders. It is calculated as follows:
ROA = Adjusted Net Income / Average Total Assets.
In general, a higher return on assets suggests management is utilizing the asset base efficiently. Unfortunately for Wendy's shareholders, the company's ROA of 1.6% is also well below that of its peers.
In addition, finbox.io's average fair value estimate of $13.49 implies -17.0% downside and is calculated from 8 valuation models as shown in the table below. Each analysis uses consensus Wall Street estimates for the projections when available.
| Analysis | Model Fair Value | Upside (Downside) |
|---|---|---|
| 10-yr DCF Revenue Exit | $8.70 | -46.5% |
| Peer Revenue Multiples | $10.65 | -34.5% |
| 10-yr DCF EBITDA Exit | $17.99 | 10.6% |
| 5-yr DCF EBITDA Exit | $19.18 | 17.9% |
| Peer EBITDA Multiples | $13.28 | -18.3% |
| 10-yr DCF Growth Exit | $13.42 | -17.5% |
| 5-yr DCF Growth Exit | $13.10 | -19.4% |
| Peer P/E Multiples | $11.61 | -28.6% |
| Average | $13.49 | -17.0% |
| Median | $13.19 | -18.9% |
On a fundamental basis, Wendy's stock appears to be trading at a premium to its intrinsic value. This could be a reason why Nelson Peltz is reducing his stake in the company.
It is important to note that investors should never blindly copy the trading activity of illustrious money managers such as Nelson Peltz. However, keeping an eye on their buying and selling activity will help in making a more informed decision.
Here are a few additional items that you should consider before drawing a conclusion:
Valuation: how much upside do shares of Wendy's have based on Wall Street's consensus price target? Take a look at our analyst upside data explorer that compares the company's upside relative to its peers.
Risk Metrics: what is Wendy's financial health? Find out by viewing our financial leverage data metric which plots the dollars in total assets for each dollar of common equity over time.
Risk Metrics: how much interest coverage does Wendy have? This is a ratio used to assess a firm's ability to pay interest expenses based on operating profits (EBIT). View the company's interest coverage here.
Author: Brian Dentino
Expertise: financial technology, analyzing market trends
Brian is a founder at finbox.io, where he's focused on building tools that make it faster and easier for investors to research stock fundamentals. Brian's background is in physics & computer science and previously worked as a software engineer at GE Healthcare. He enjoys applying his expertise in technology to help find market trends that impact investors.
Brian can be reached at [email protected].
As of this writing, Brian did not hold a position in any of the aforementioned securities and this is not a buy or sell recommendation on any security mentioned.


.%20Is%20The%20Stock%20Overvalued%3F)