Last week I highlighted the Top 10 Value Stocks In The S&P 500 noting that "value will have its day in the sun" in 2018.
This is not a widely held view considering the Russell 1000 Growth index (IWF) has returned 32.2% over the last year while the Russell 1000 Value index (IWD) has returned only 14.7%. Furthermore, high flying Netflix (NasdaqGS: NFLX) jumped to another all-time high after reporting Q4 numbers on Monday after the bell. Total subscriber growth increased 25.4% YoY which helped send the company's market cap to over $100 billion. The chart below highlights Netflix amazing growth as well as its -$510 million cash burn in Q4 (-$2 billion in fiscal year 2017).
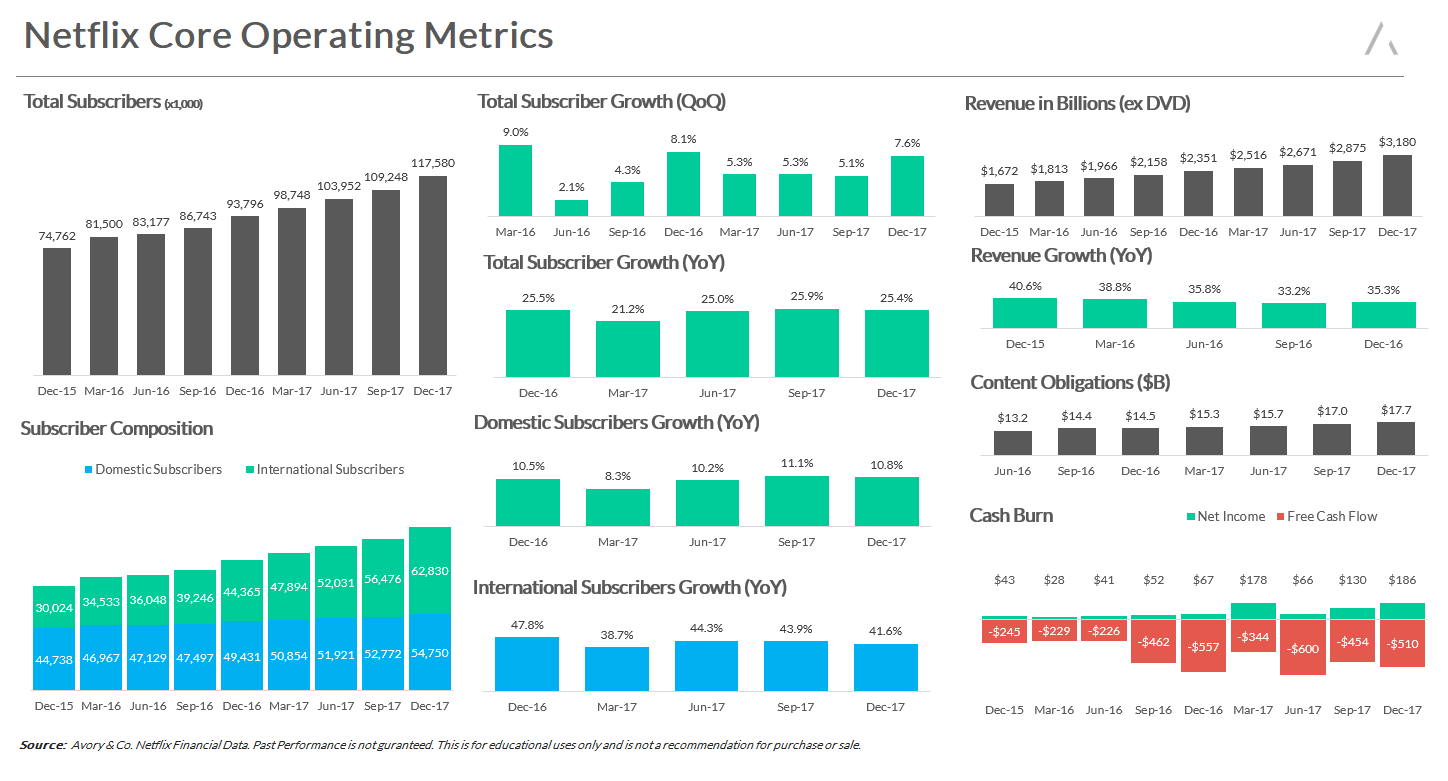
Source: Avory & Co.
Netflix is a timely reminder of just how much momentum these growth stocks continue to have in this market, no matter what valuation multiple they trade at. And while research suggests owning high quality value stocks significantly outperforms in the long-run, high quality growth stocks (such as Netflix) still have steam. Therefore, I decided to find companies that may be masquerading around as high growth stocks but really are not to be trifled with.
In order to find these pricey stocks, I downloaded the list of S&P 500 constituents and then used finbox.io's spreadsheet add-on to find which companies had the following:
-
a P/E multiple that trades above its comparable public companies, and
-
projected 5-year earnings growth that's below its comparable public companies.
OR
-
an EBITDA multiple that trades above its comparable public companies, and
-
projected 5-year EBITDA growth that's below its comparable public companies.
AND
- has downside as calculated from finbox.io's fair value > 20%.
Here are the 10 most expensive stocks in the S&P 500 that I found.
The 10 Most Expensive Stocks In The S&P 500: ProLogis
ProLogis (NYSE: PLD) is a global leader in logistics real estate with a focus on high-barrier, high-growth markets. As of September 30, 2017, the company owned or had investments in properties and development projects expected to total approximately 687 million square feet in 19 countries. Prologis leases modern distribution facilities to a diverse base of approximately 5,200 customers across two major categories: business-to-business and retail/online fulfillment.
Analysts covering the stock often compare the company to a peer group that includes Duke Realty (NYSE: DRE), DCT Industrial Trust (NYSE: DCT), First Industrial Realty Trust (NYSE: FR) and EastGroup Properties (NYSE: EGP).
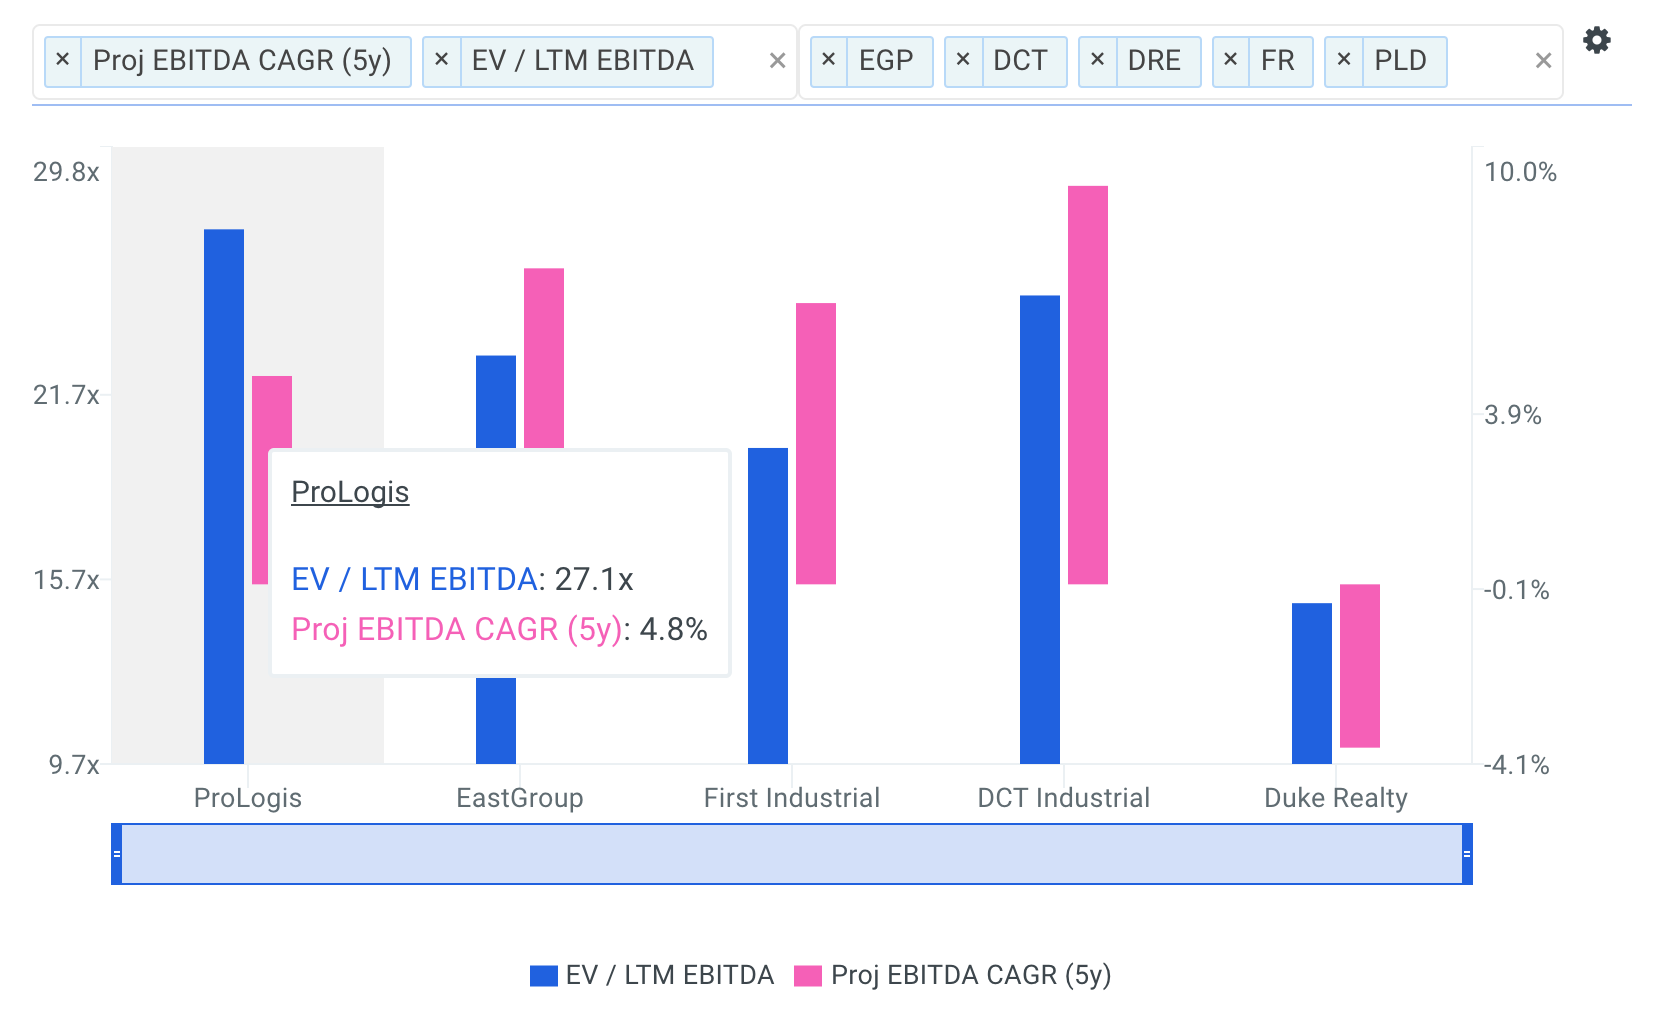
The company's LTM EBITDA multiple of 27.1x is above all of its selected comparable public companies: DRE (14.9x), DCT (24.8x), FR (19.8x) and EGP (22.7x). Therefore you would expect the company's future growth to be above its peer group. However, ProLogis' projected 5-year EBITDA CAGR of 4.8% is only above DRE (-3.7%) and below DCT (9.1%), FR (6.4%) and EGP (7.2%).
Source: finbox.io
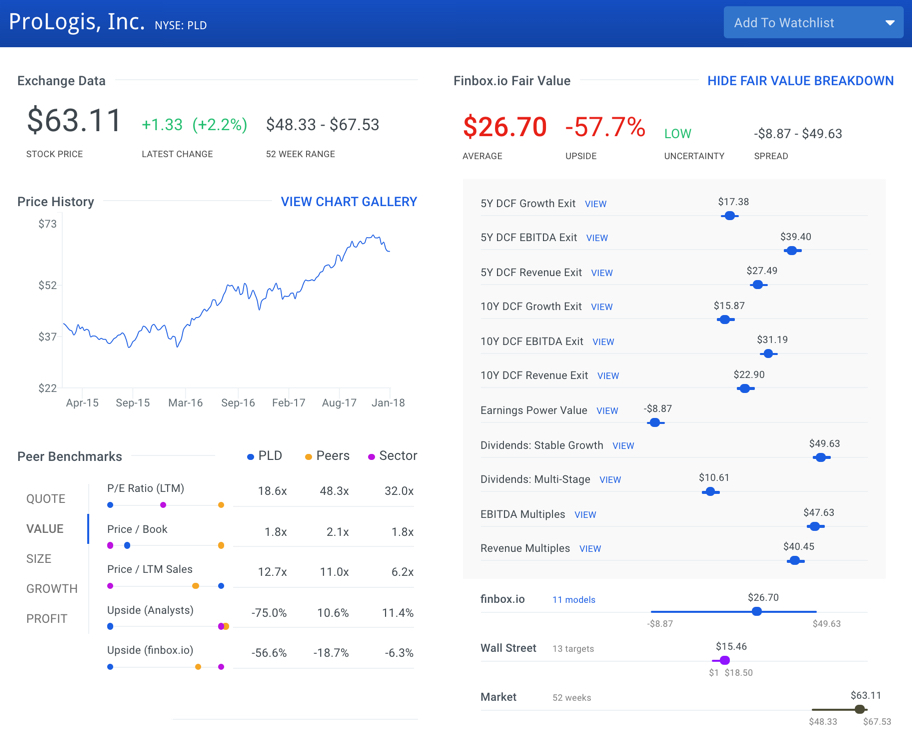
Shares of the company are up 21.1% over the last year. The stock last traded at $63.11 as of Monday January 22 and eleven separate valuation analyses imply that there is significant downside relative to its current trading price.
The 10 Most Expensive Stocks In The S&P 500: Macerich
Macerich (NYSE: MAC) is a fully integrated self-managed and self-administered real estate investment trust, which focuses on the acquisition, leasing, and management of regional malls throughout the United States. Macerich currently owns 54 million square feet of real estate consisting primarily of interests in 48 regional shopping centers.
On a comparable company basis, selected benchmark companies include CBL & Associates Properties (NYSE: CBL), Brixmor Property Group (NYSE: BRX), Kimco Realty (NYSE: KIM) and Federal Realty Investment (NYSE: FRT). Higher growth companies typically trade at higher valuation multiples but this does not appear to be the case for Macerich as shown below.
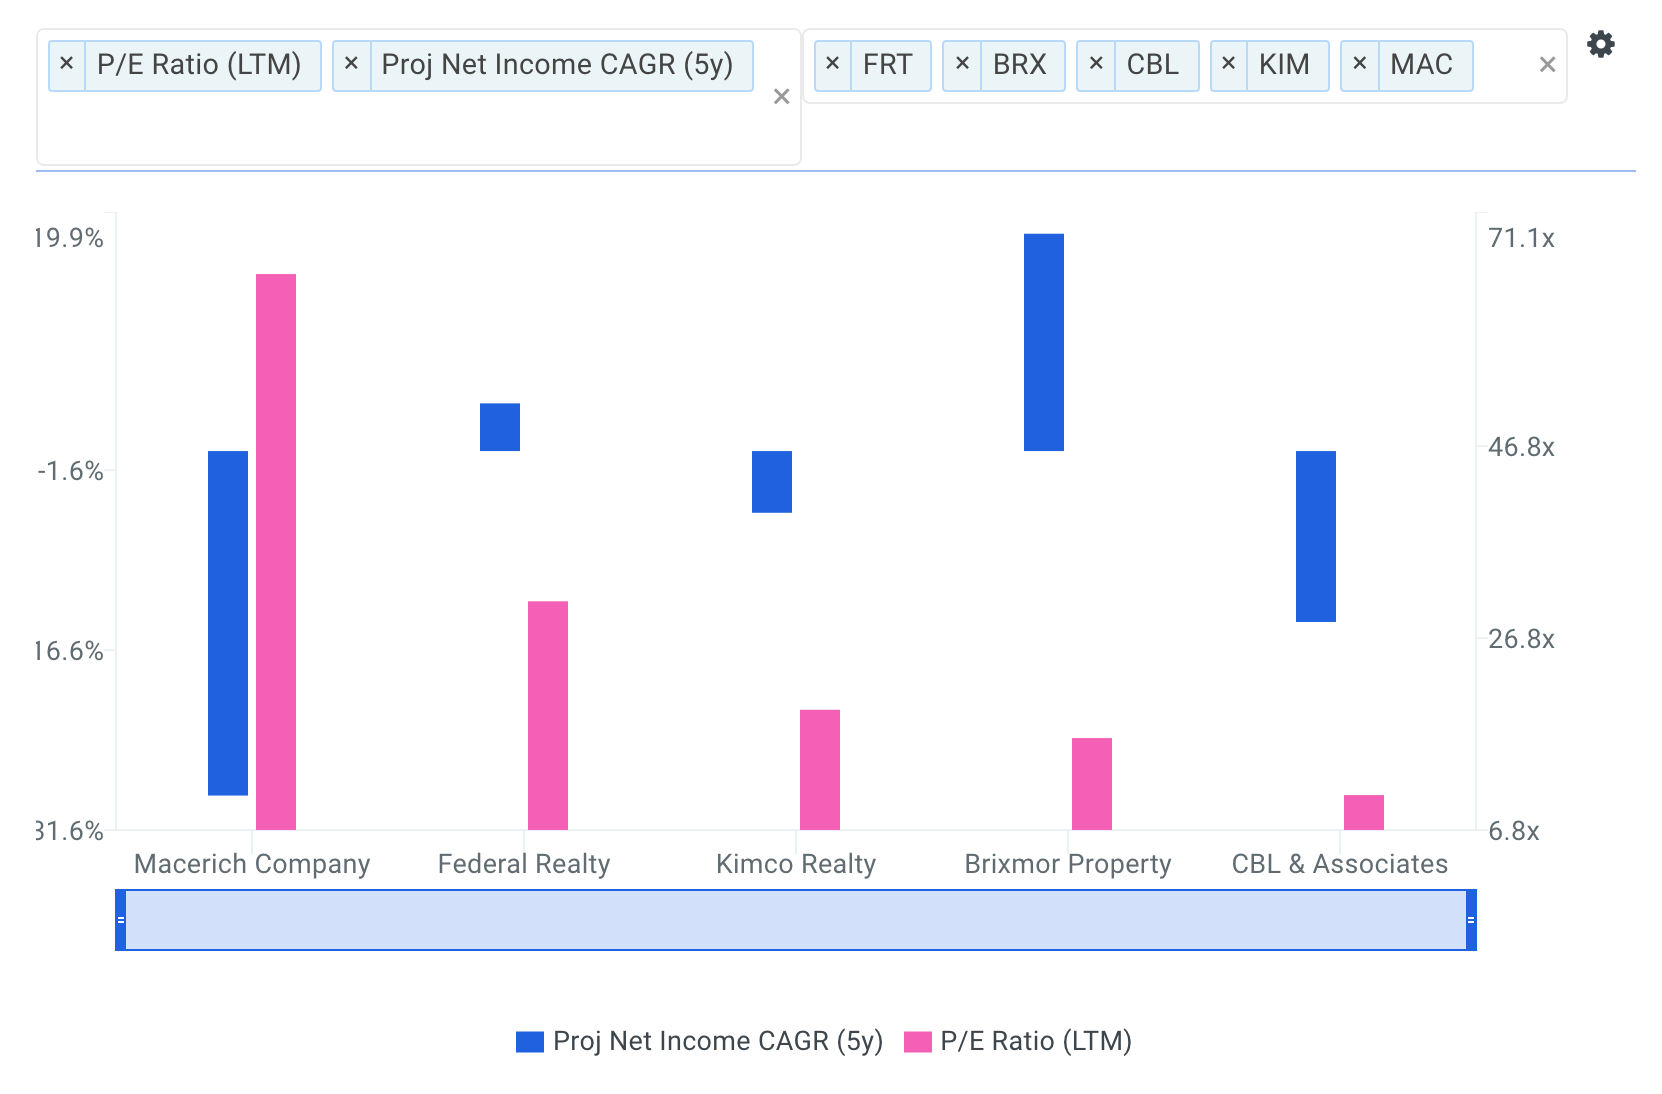
The company's projected 5-year net income CAGR of -28.7% is well below its entire peer group: CBL (-14.3%), BRX (18.1%), KIM (-5.1%) and FRT (4.0%). However, Macerich's P/E multiple of 64.7x is above CBL (10.4x), BRX (16.3x), KIM (19.3x) and FRT (30.6x).
The company appears to be expensive on a future cash flow basis as well.
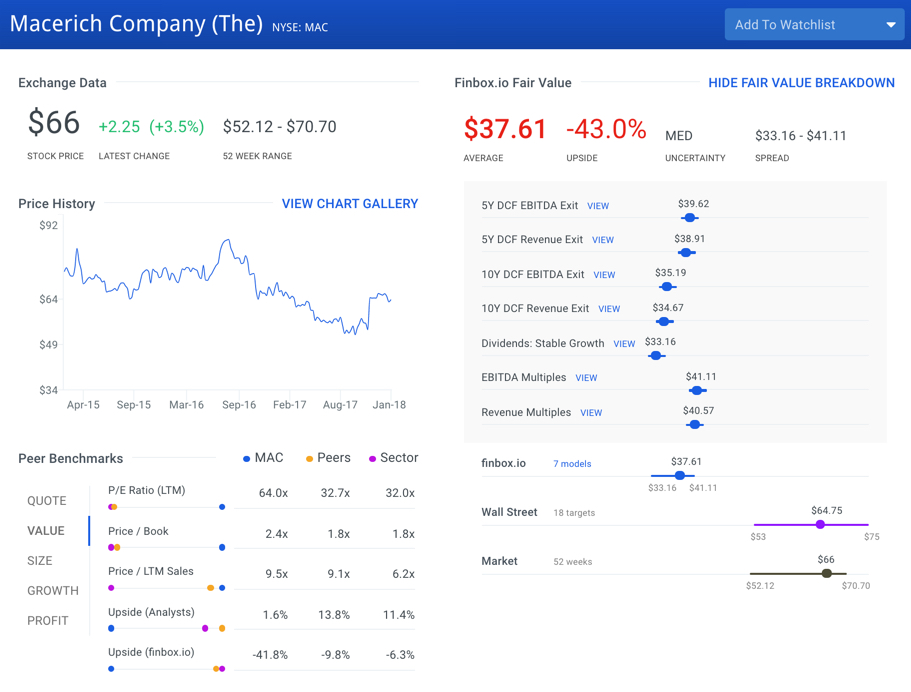
Source: finbox.io
Shares of Macerich are down -4.4% over the last year and finbox.io's fair value estimate of $37.61 per share calculated from seven cash flow models imply -43.0% downside.
The 10 Most Expensive Stocks In The S&P 500: Align Technology
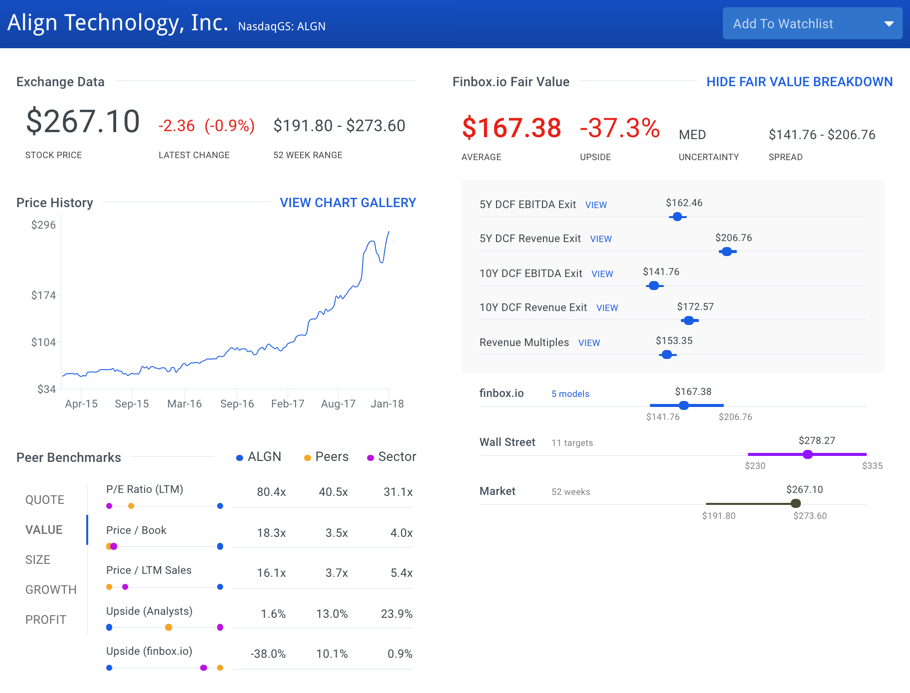
Align Technology (NasdaqGS: ALGN) manufactures and markets a system of clear aligner therapy, intra-oral scanners, and computer-aided design and computer-aided manufacturing (CAD/CAM) digital services. The company was founded in 1997 and is headquartered in San Jose, California.
The company's valuation multiples currently look expensive relative to peers: Cooper Companies (NYSE: COO), Dentsply Sirona (NasdaqGS: XRAY), AbbVie (NYSE: ABBV) and Cutera (NasdaqGS: CUTR).
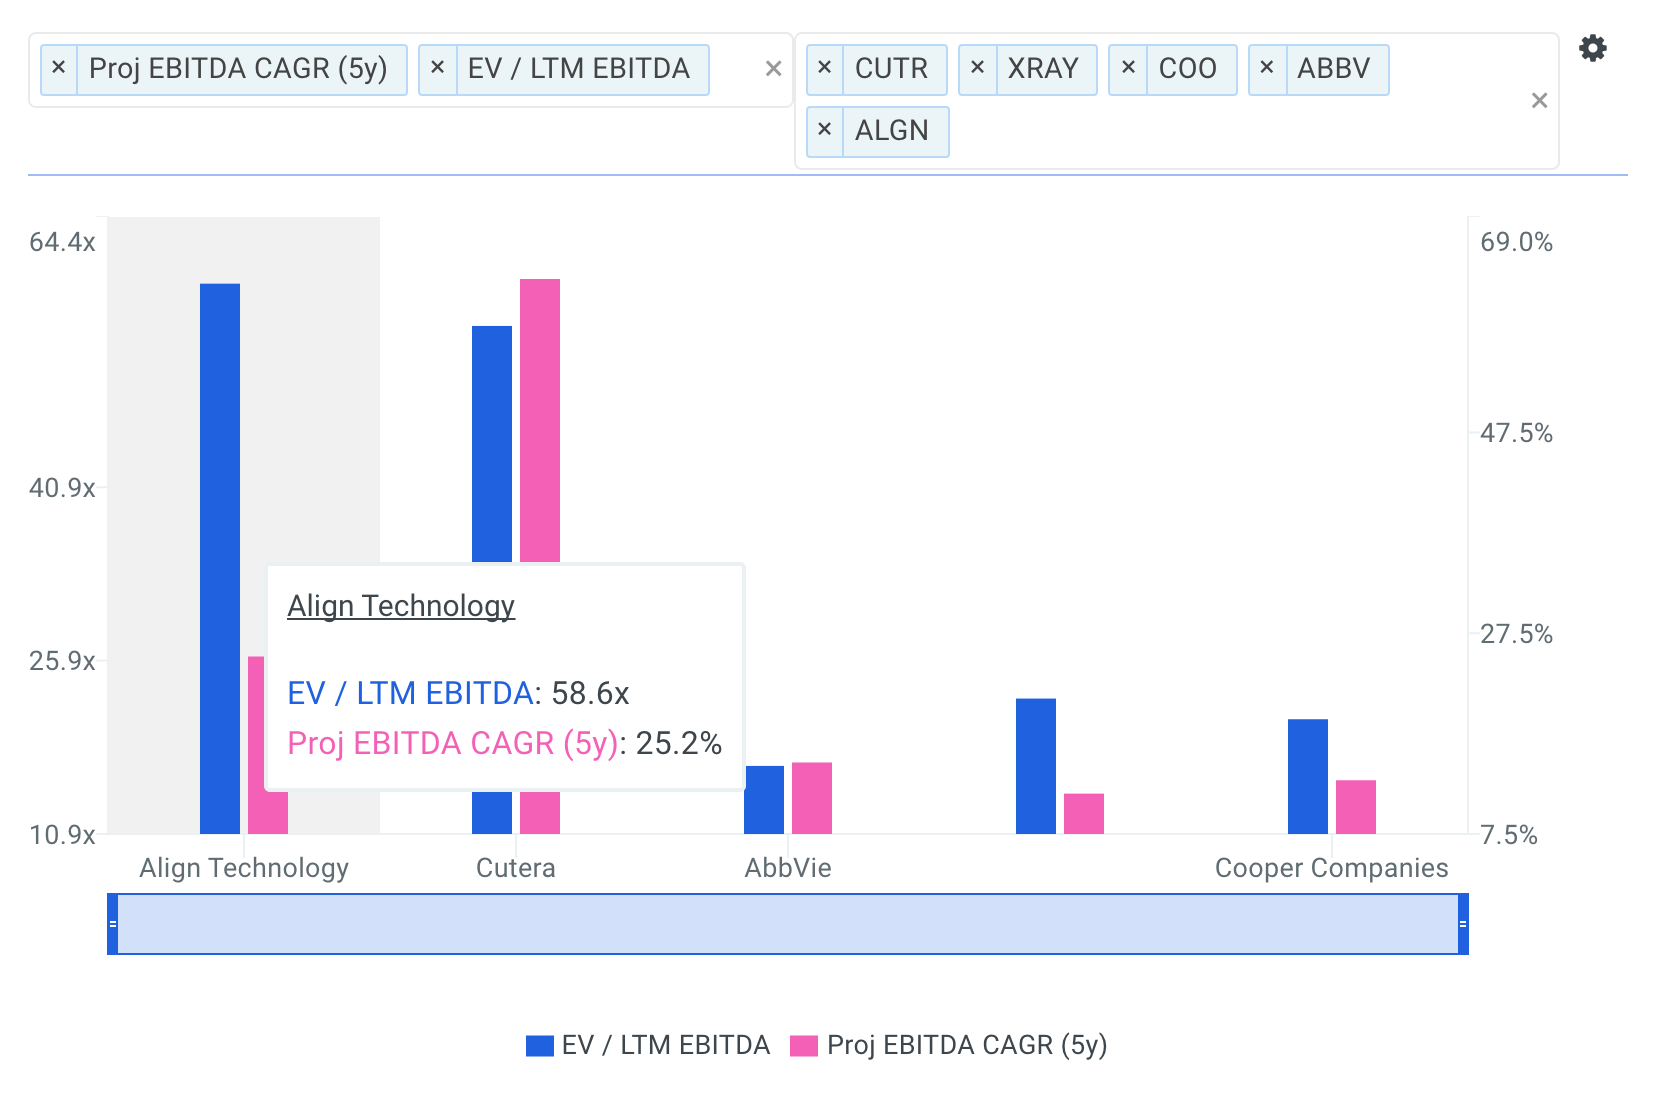
Align Technology's LTM EBITDA multiple of 60.1x is above COO (20.8x), XRAY (22.7x), ABBV (16.6x) and CUTR (54.9x). Cutera's multiple is only slightly below Align Technology's but Wall Street analysts project that the former will grow its cash flows by 62.8% annually over the next five years. This is well above Align Technology's forecasted five-year EBITDA CAGR of 25.2%.
Source: finbox.io
Align Technology's stock currently trades at $267.10 per share as of Monday January 22, up 190.2% over the last year. However, finbox.io's five valuation analyses suggest that shares are now roughly 35% overvalued.
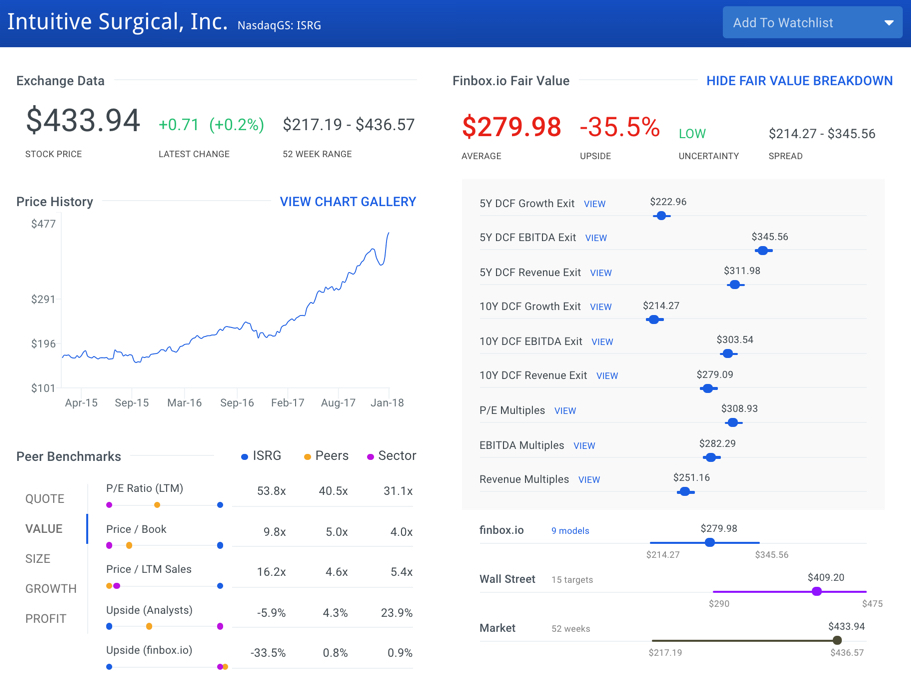
The 10 Most Expensive Stocks In The S&P 500: Intuitive Surgical
Intuitive Surgical (NasdaqGS: ISRG) manufactures and markets da Vinci surgical systems, and related instruments and accessories. The company’s da Vinci surgical System translates a surgeon’s natural hand movements, which are performed on instrument controls at a console into corresponding micro-movements of instruments positioned inside the patient through small incisions or ports. The company also manufactures EndoWrist instruments that include scissors, scalpels, and other surgical tools. It markets its products directly and through distributors in the worldwide. Intuitive Surgical, Inc. was founded in 1995 and is headquartered in Sunnyvale, California.
Analysts covering the stock often compare Intuitive Surgical to a peer group that includes Edwards Lifesciences (NYSE: EW), Hill-Rom (NYSE: HRC), Varian Medical Systems (NYSE: VAR) and Becton, Dickinson (NYSE: BDX).
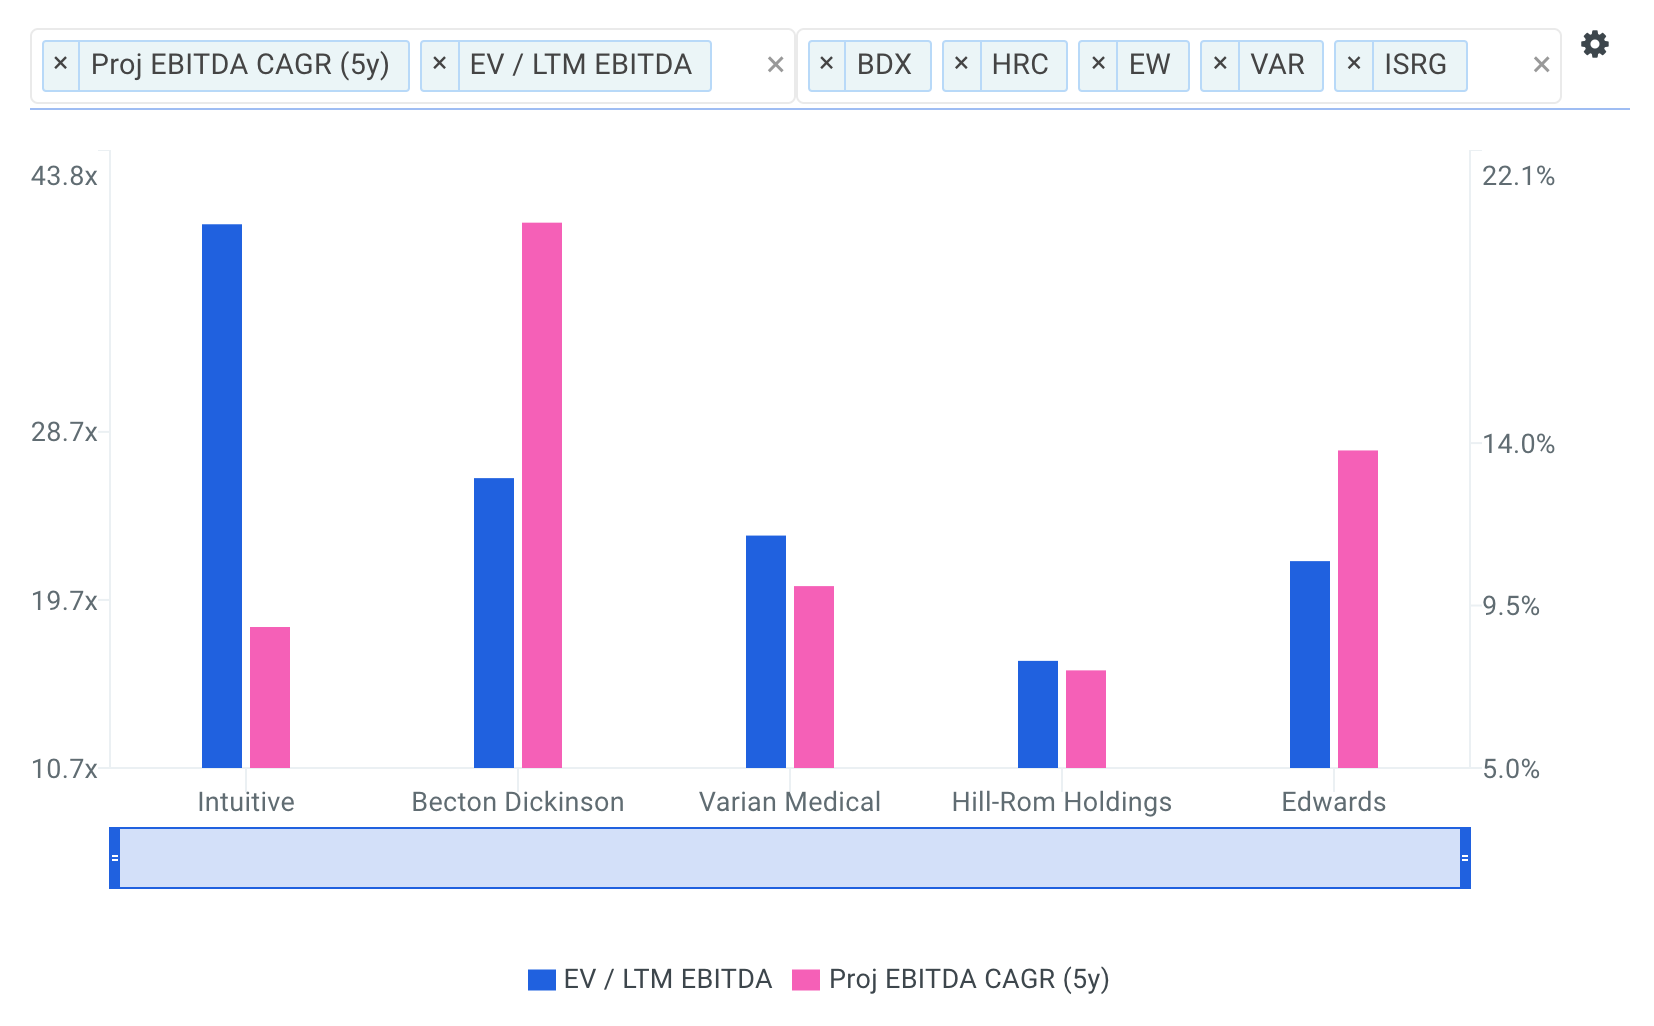
The company's LTM EBITDA multiple of 39.8x is above all of these comparable public companies: EW (21.7x), HRC (16.4x) and BDX (26.2x). However, notice how the company's projected 5-year EBITDA CAGR of 8.9% is only above HRC (7.7%) and below EW (13.8%), VAR (10.1%) and BDX (20.1%). This implies that the market's valuing Intuitive Surgical at a premium.
Source: finbox.io
Shares of the company are trading 97.9% higher year over year. But the stock price could end up trading -35.5% lower in 2018 based on Intuitive Surgical's future cash flow projections.
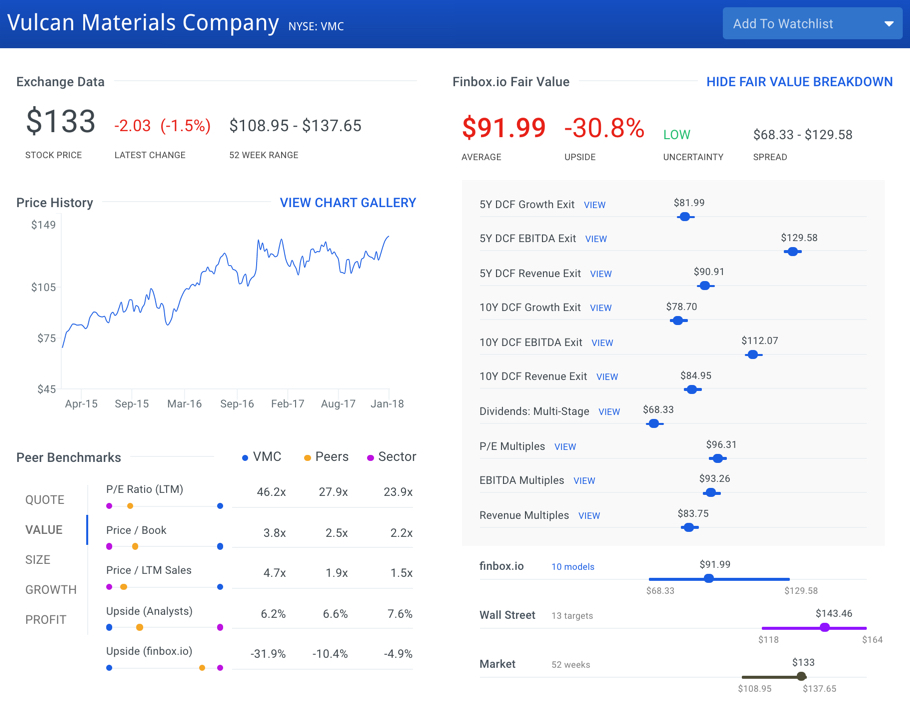
The 10 Most Expensive Stocks In The S&P 500: Vulcan Materials
Vulcan Materials (NYSE: VMC) produces and sells construction aggregates, asphalt mix, and ready-mixed concrete primarily in the United States. Vulcan Materials was founded in 1909 and is headquartered in Birmingham, Alabama.
On a comparable company basis, selected benchmark companies include Martin Marietta Materials (NYSE: MLM), Summit Materials (NYSE: SUM), Eagle Materials (NYSE: EXP) and CRH Plc (NYSE: CRH). Analyzing Vulcan Materials' valuation metrics and growth ratios provides further insight into why the stock is expensive.
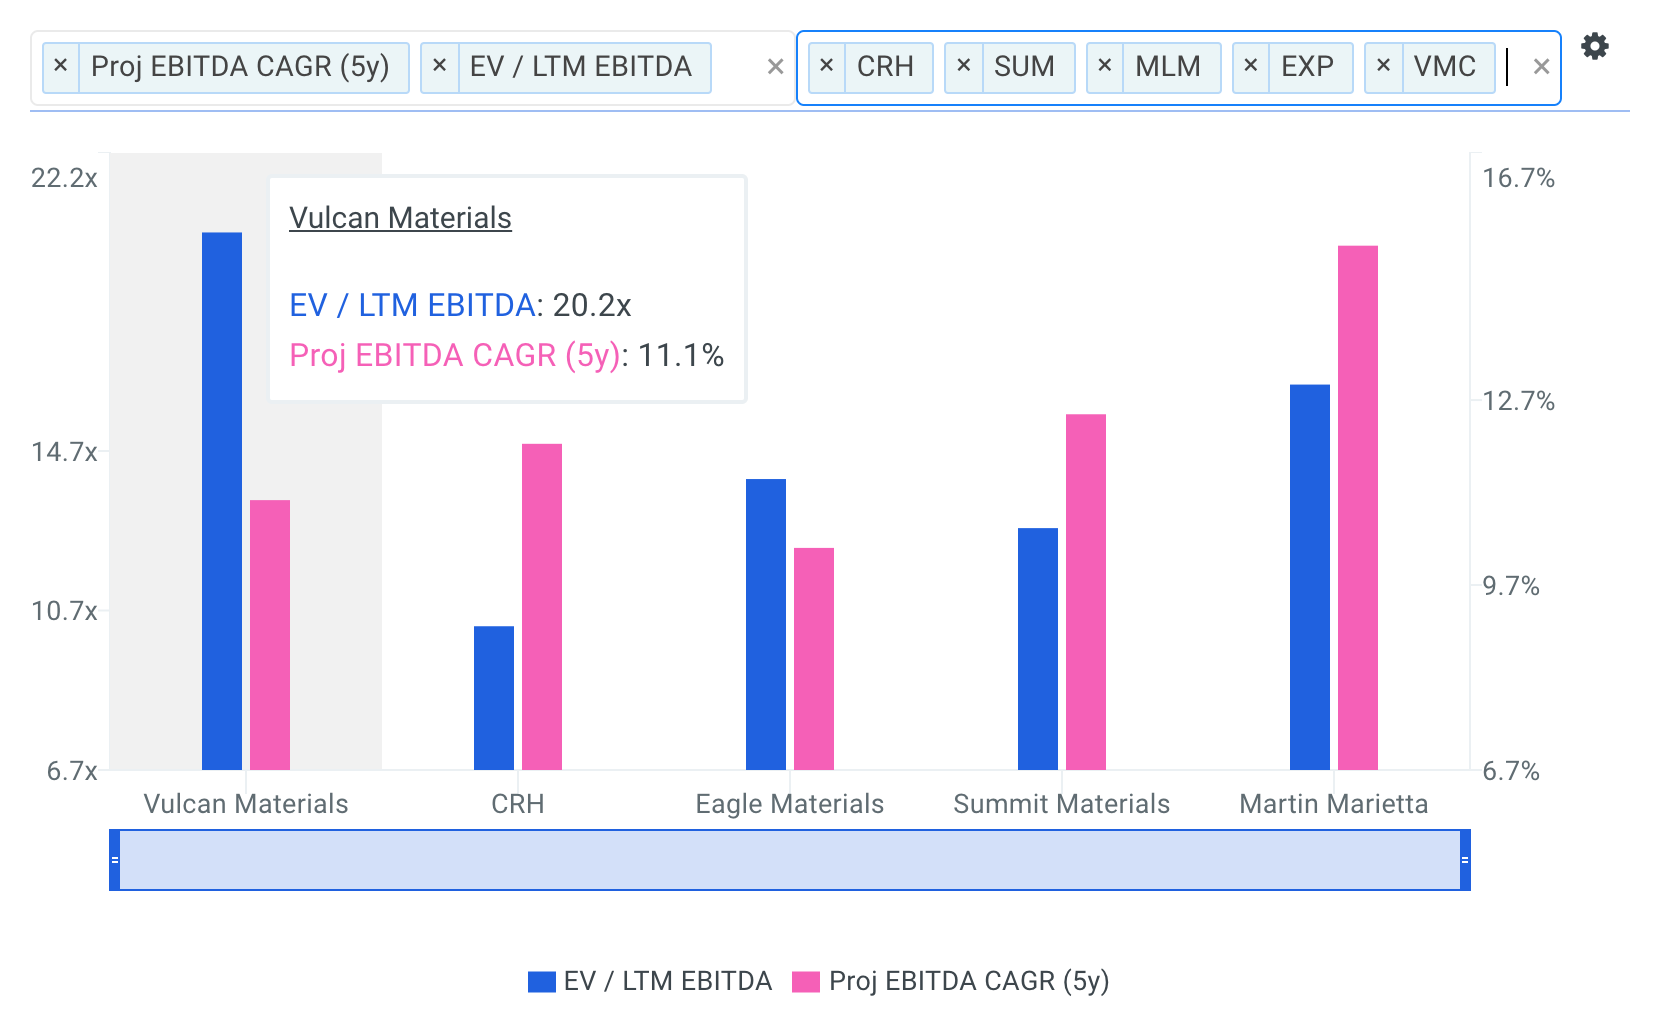
Wall Street analysts project that the company's EBITDA grows at 11.1% over the next five years. This growth rate is only above EXP (10.3%) and below MLM (15.2%), SUM (12.5%) and CRH (12.0%). However, Vulcan Materials' EBITDA multiple trades well above this same peer group implying the stock is quite expensive.
Source: finbox.io
Vulcan Materials' stock currently trades at $133.00 per share as of Monday January 22, up 4.8% over the last year. On a fundamental basis, the company's stock is trading at a -30.8% premium to finbox.io's intrinsic value estimate.
The 10 Most Expensive Stocks In The S&P 500: Mettler-Toledo
Mettler-Toledo (NYSE: MTD) manufactures and supplies precision instruments and services worldwide. The company offers weighing instruments for laboratory, industrial, packaging, logistics, and food retailing applications. Mettler-Toledo markets its products through its direct sales force and indirect distribution channels. The company was founded in 1991 and is based in Columbus, Ohio.
The company's valuation multiples implied by the market currently trade above comparable companies Waters Corp (NYSE: WAT), PerkinElmer (NYSE: PKI), Agilent Technologies (NYSE: A) and Thermo Fisher Scientific (NYSE: TMO).
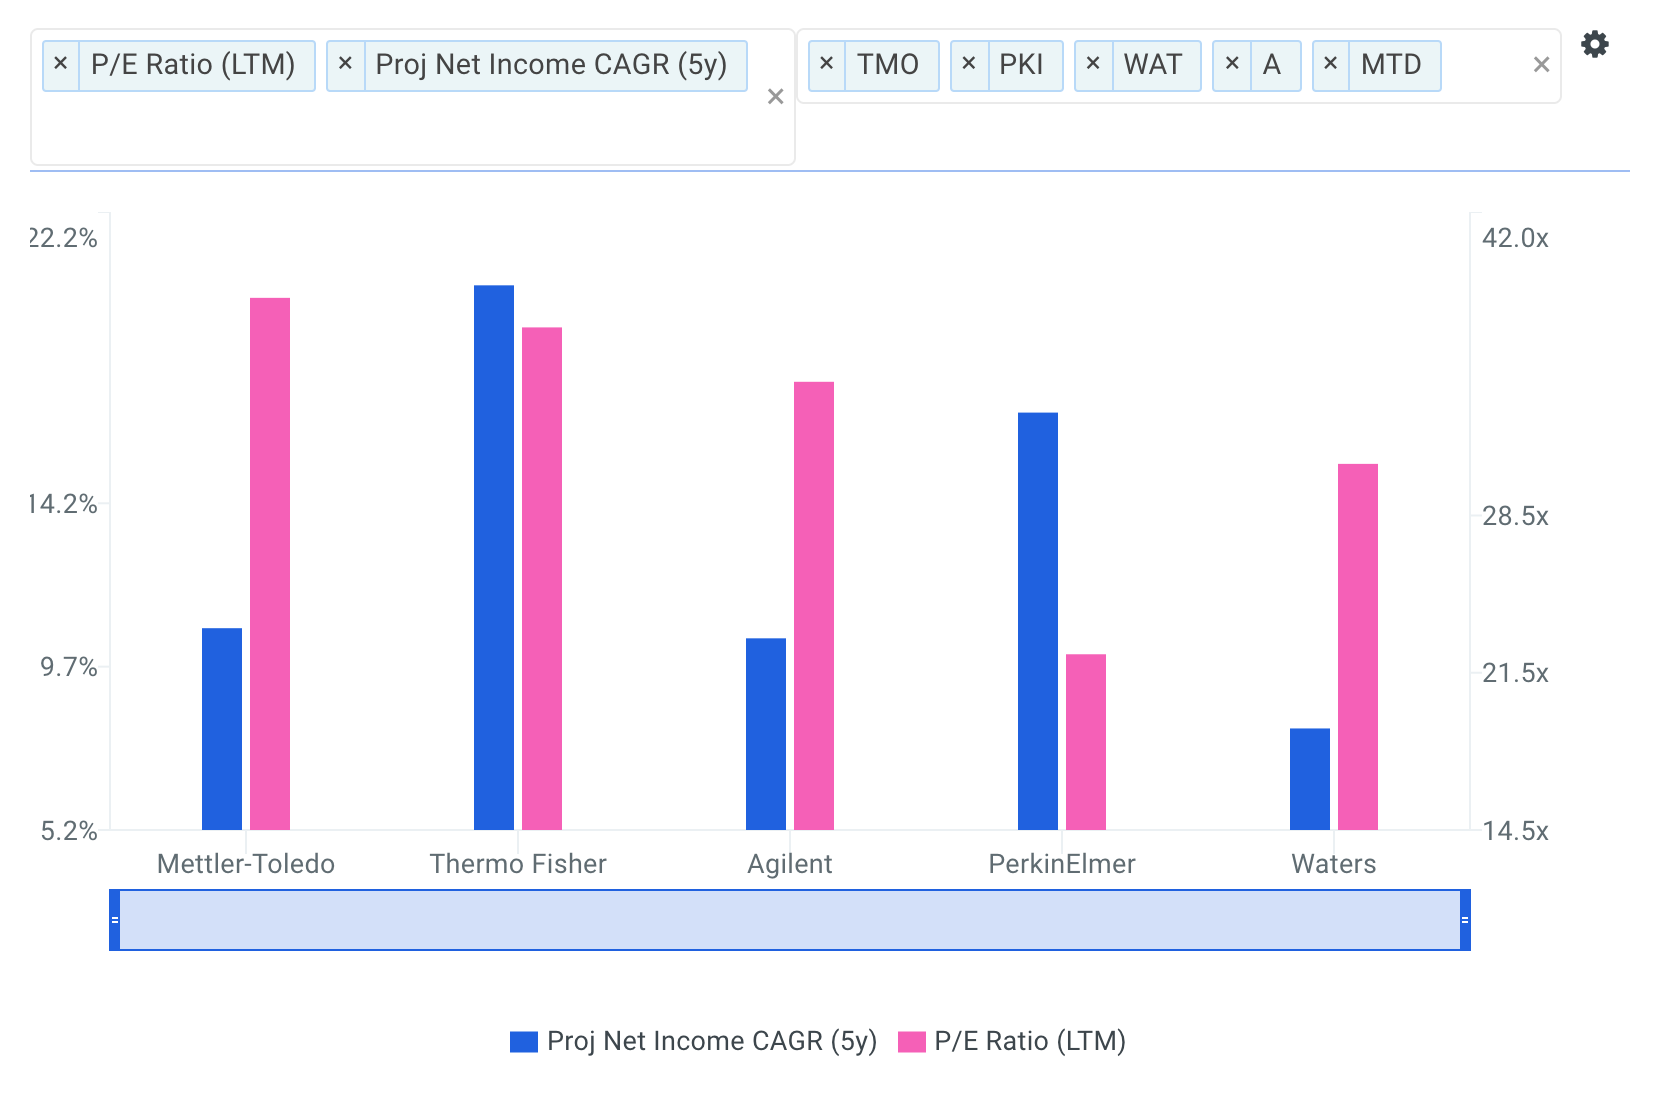
Mettler-Toledo's LTM P/E multiple of 38.2x is above WAT (30.8x), PKI (22.4x), A (34.5x) and TMO (36.9x) while its growth is mediocre at best.
Source: finbox.io
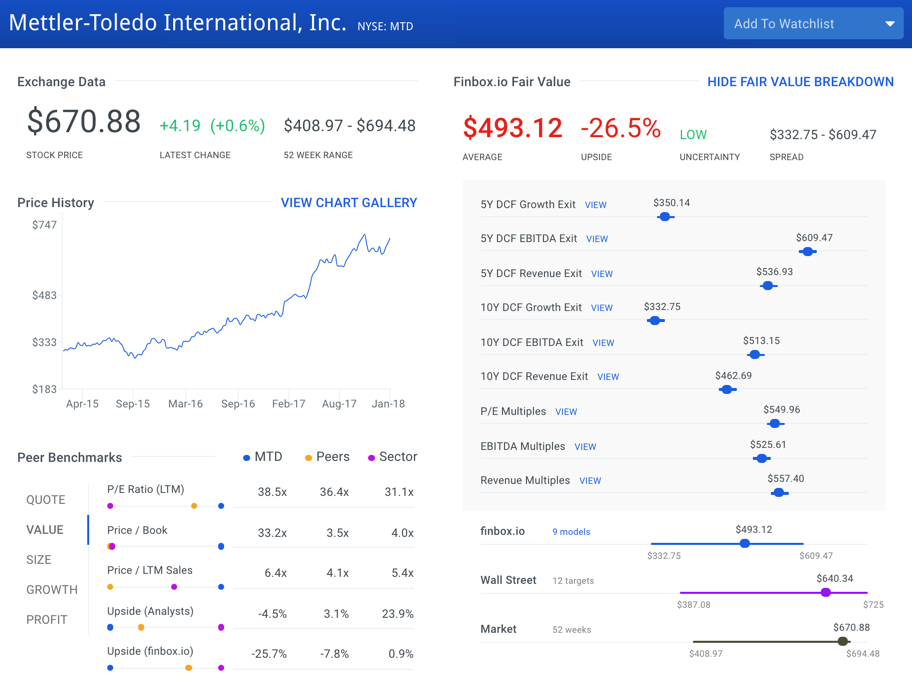
Shares of the company are up 60.6% over the last year. The stock last traded at $670.88 as of Monday January 22 and nine separate valuation analyses imply that there is -26.5% downside relative to its current trading price.
The 10 Most Expensive Stocks In The S&P 500: Mattel
Mattel (NasdaqGS: MAT) designs, manufactures, and markets a range of toy products worldwide. It offers dolls and accessories, vehicles and play sets, and games and puzzles under the Mattel Girls & Boys brands, including Barbie, Polly Pocket, DC Super Hero Girl, Disney Classics, Hot Wheels, Matchbox, CARS, DC Comics, WWE Wrestling, Minecraft, and Toy Story. The company also provides its products under the Fisher-Price brands. In addition, it offers its products under the American Girl brands. Mattel sells its products directly to consumers via its catalog, website, and proprietary retail stores, as well as directly to retailers and distributors. The company was founded in 1945 and is headquartered in El Segundo, California.
Sell-side research analysts often compare the company to a peer group that includes Brunswick (NYSE: BC), Polaris Industries (NYSE: PII), Acushnet Holdings (NYSE: GOLF) and Hasbro (NasdaqGS: HAS). Notice Mattel's projected EBITDA growth of 0% in the chart below.
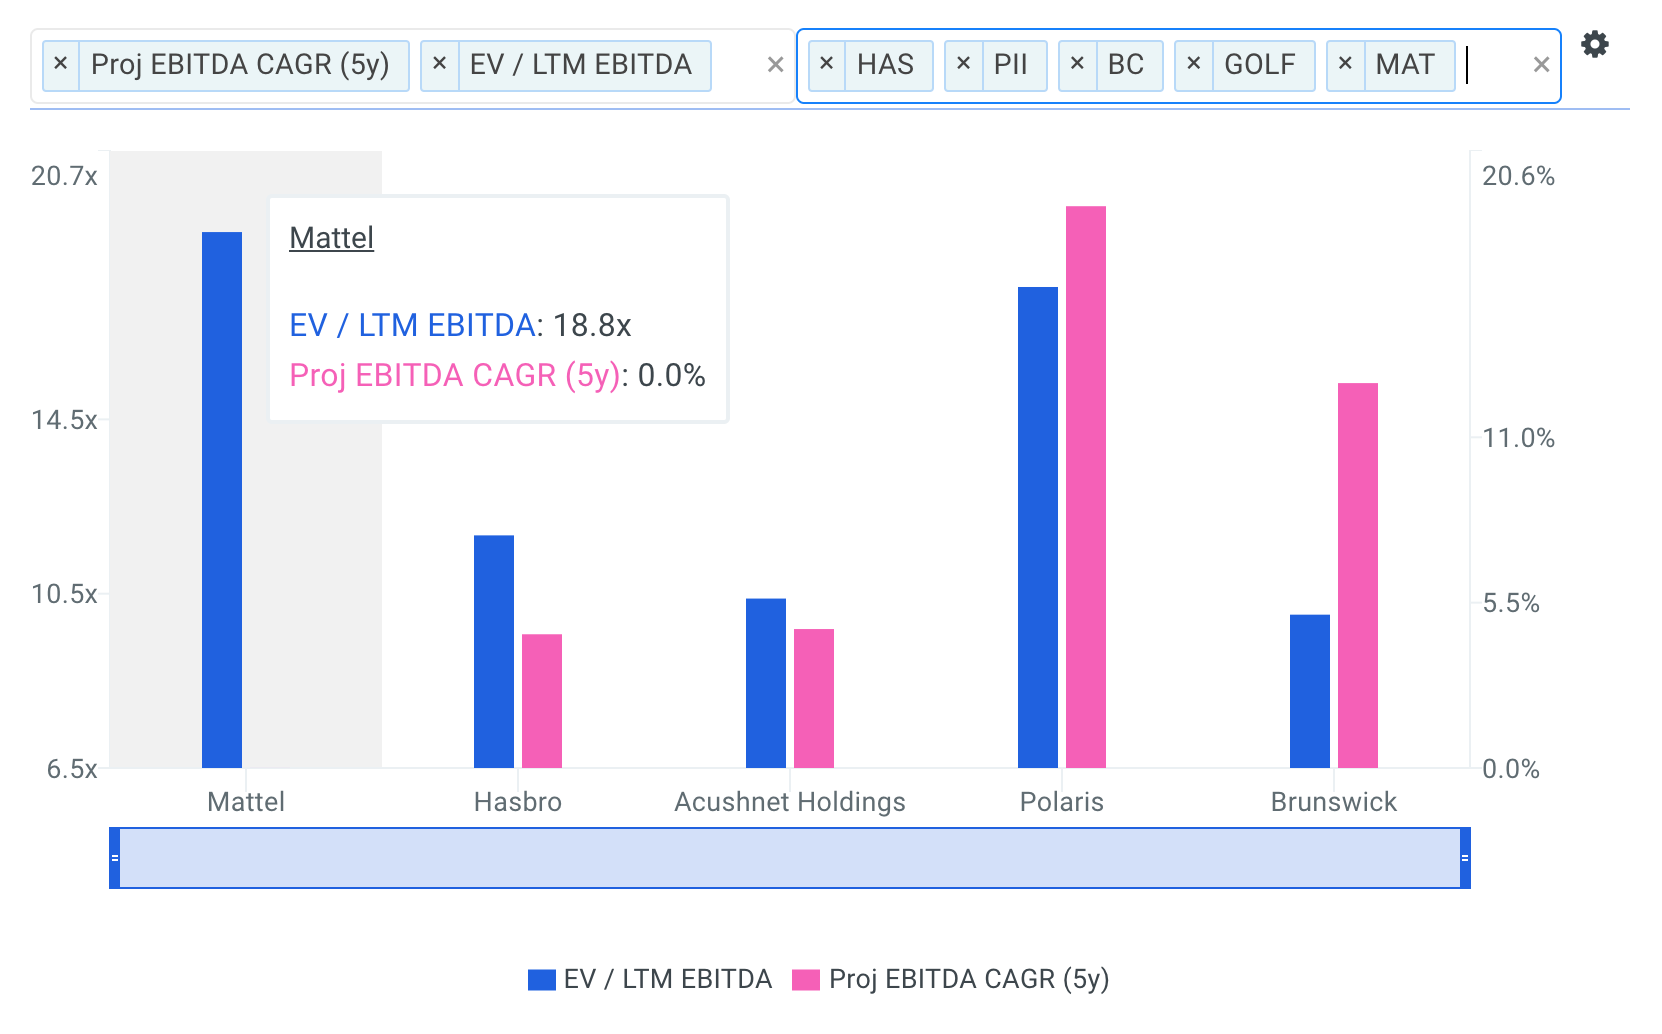
Analysts expect that the company's EBITDA will reach the same level in 2021 as it did in 2016. However, investors purchasing shares today would pay 18.8x EBITDA for a low growth company. This looks very expensive when compared to Mattel's peers.
Source: finbox.io
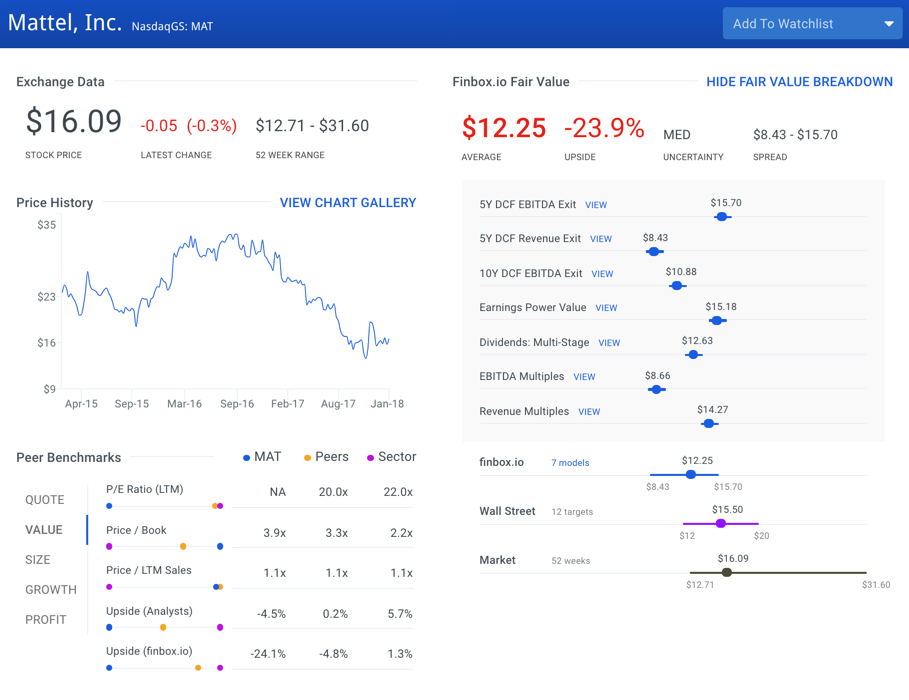
Shares of Mattel are down -44.0% over the last year and finbox.io's fair value estimate of $12.25 per share calculated from seven cash flow models imply -23.9% downside. The average price target from 12 Wall Street analysts of $15.50 per share similarly imply downside.
The 10 Most Expensive Stocks In The S&P 500: C.H. Robinson
C.H. Robinson (NasdaqGS: CHRW) is a third party logistics company providing freight transportation services and logistics solutions to companies in various industries worldwide. It has contractual relationships with approximately 107,000 transportation companies. In addition, the company is involved in buying, selling, and marketing fresh produce, including fresh fruits, vegetables, and other perishable items. C.H. Robinson was founded in 1905 and is headquartered in Eden Prairie, Minnesota.
On a comparable company basis, selected benchmark companies include XPO Logistics (NYSE: XPO), Union Pacific (NYSE: UNP), Norfolk Southern (NYSE: NSC) and United Parcel Service (NYSE: UPS). Analyzing C.H. Robinson Worldwide,'s valuation metrics and growth ratios offers insight into how shares are highly expensive.
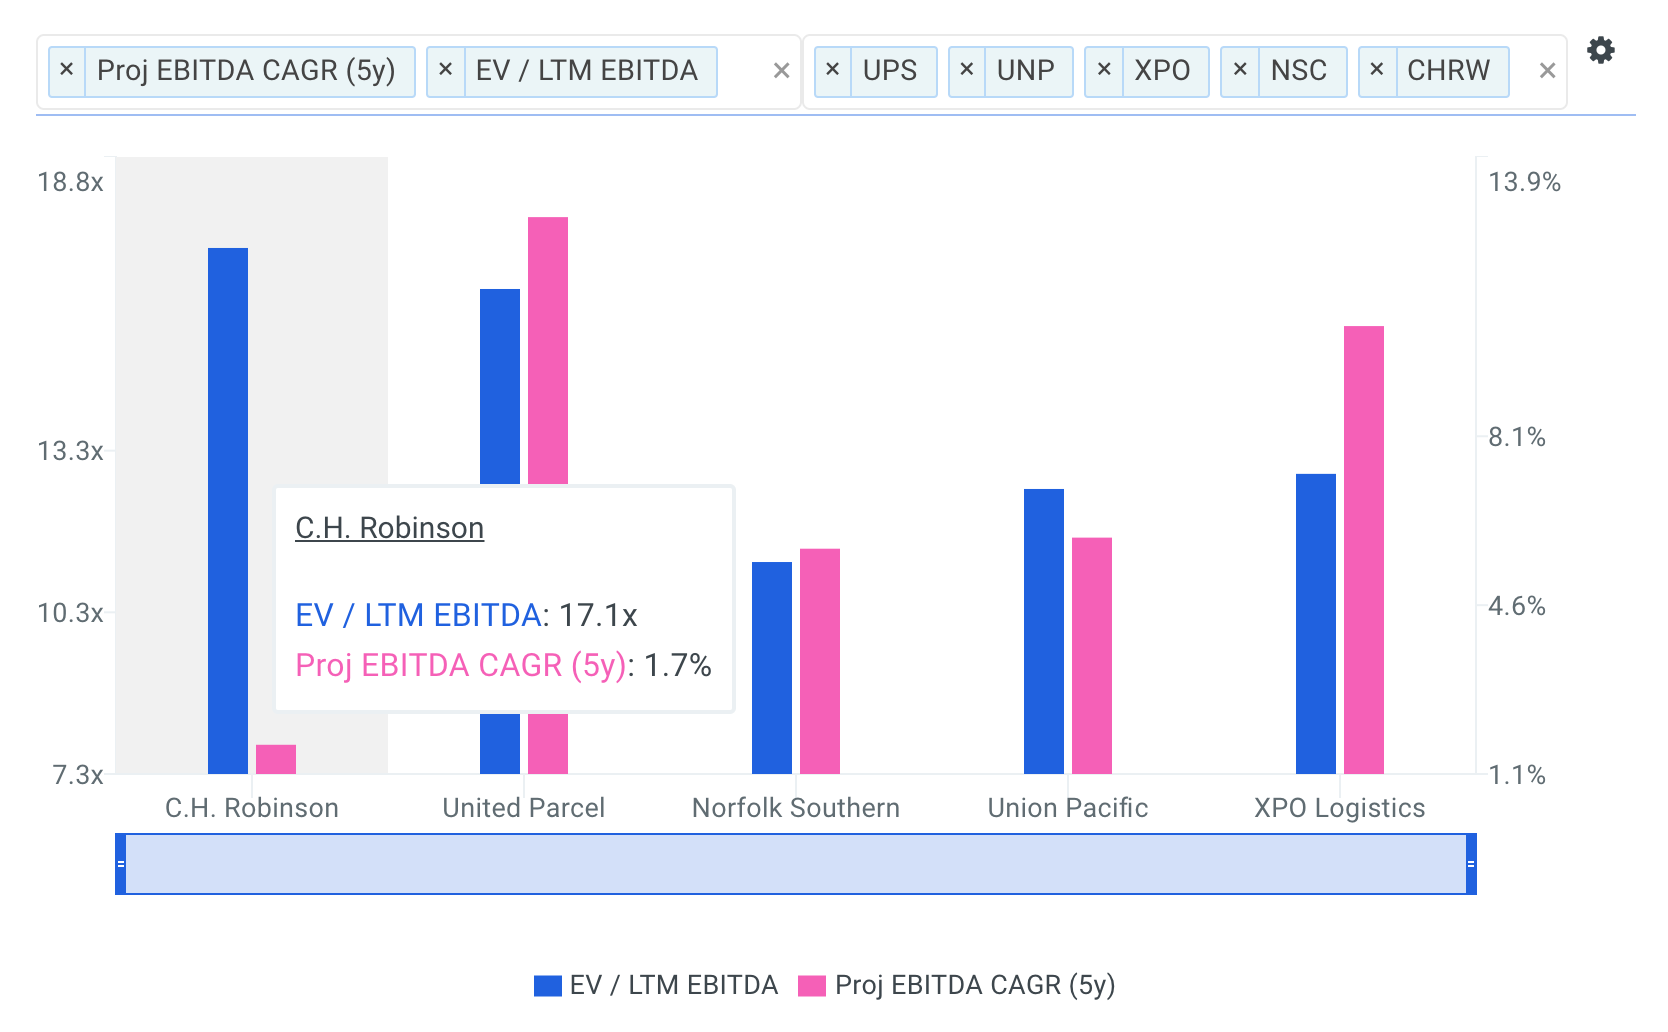
Typically, high growth companies trade at a higher multiple of EBITDA. But notice the company's projected 5-year EBITDA CAGR of 1.7% is well below all of its peers while its LTM EBITDA multiple of 17.1x is above this same peer group.
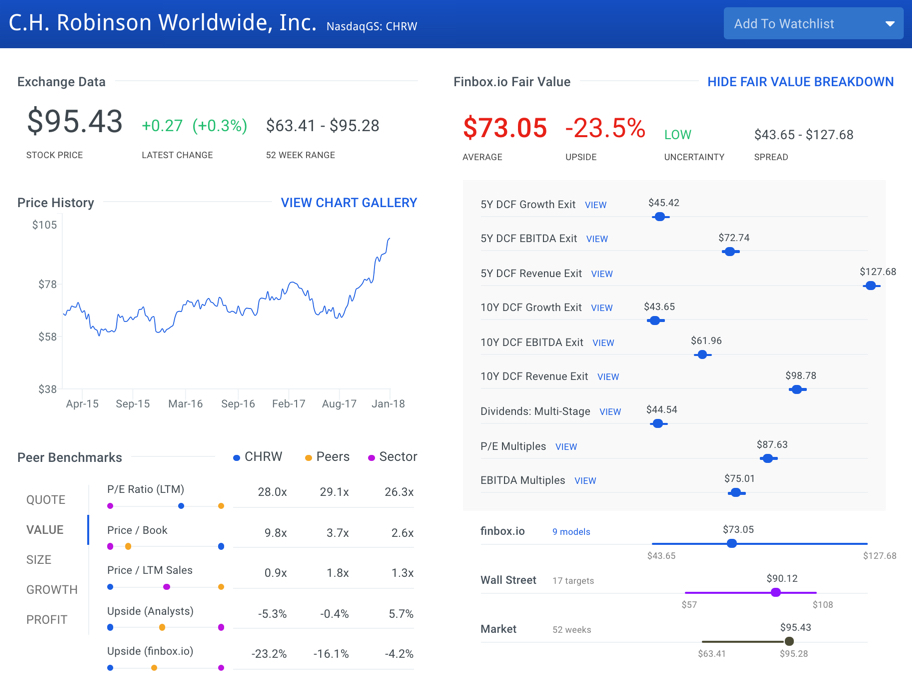
C.H. Robinson also looks overvalued on a cash flow basis as well.
Source: finbox.io
C.H. Robinson's stock currently trades at $95.43 per share as of Monday January 22, up 32.4% over the last year. Finbox.io's nine valuation analyses suggest that shares could decrease -23.5% going forward.
The 10 Most Expensive Stocks In The S&P 500: Fortive
Fortive (NYSE: FTV) manufactures, markets, and services professional and engineered products worldwide. The company’s field solutions include various professional test tools, thermal imaging, and calibration equipment for electrical, industrial, electronic, and calibration applications. Further, it manufactures and distributes professional tools, toolboxes, and automotive diagnostic equipment under the MATCO brand. Fortive also offers a line of wheel service equipment, including brake lathes, tire changers, wheel balancers, and wheel weights under the COATS brand. The company was incorporated in 2016 via a spinoff from Danaher Corp. (NYSE: DHR) and is headquartered in Everett, Washington.
Fortive's valuation multiples implied by the market currently trade above all selected comparable companies Dover (NYSE: DOV), Pentair (NYSE: PNR), Flowserve (NYSE: FLS) and AMETEK (NYSE: AME).
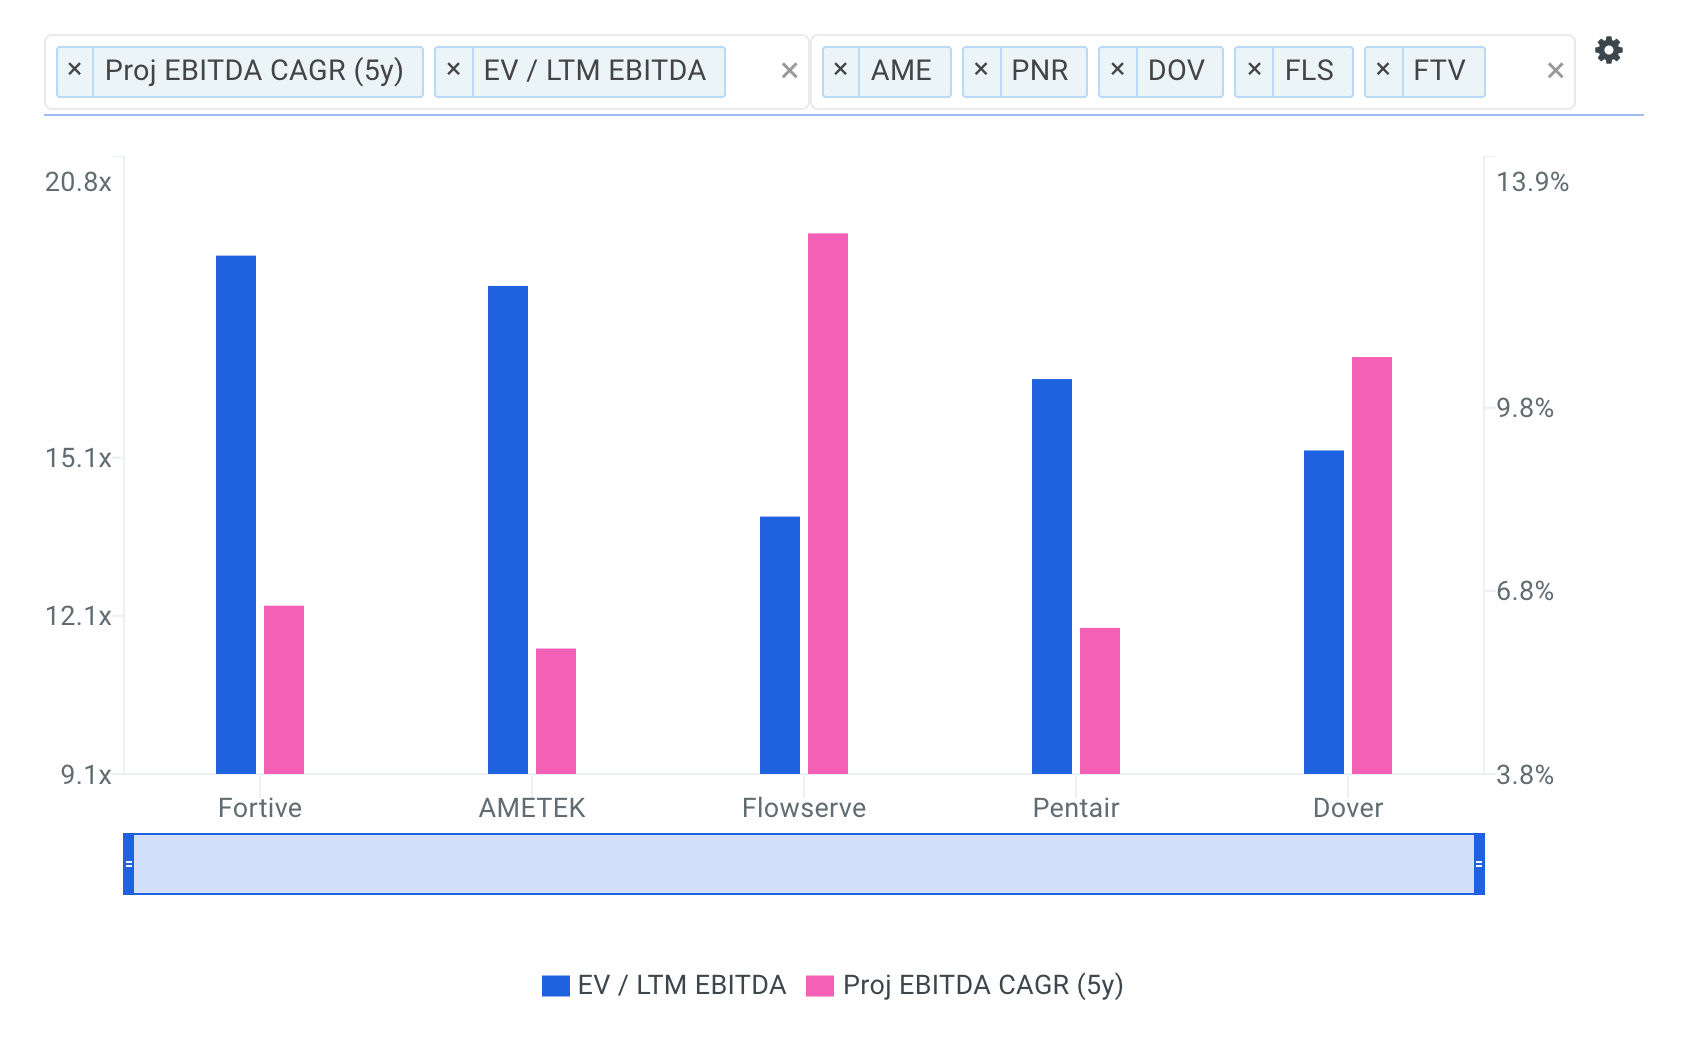
Furthermore, the company's EBITDA is only expected to grow at a quicker rate than Pentair over the next five years.
Source: finbox.io
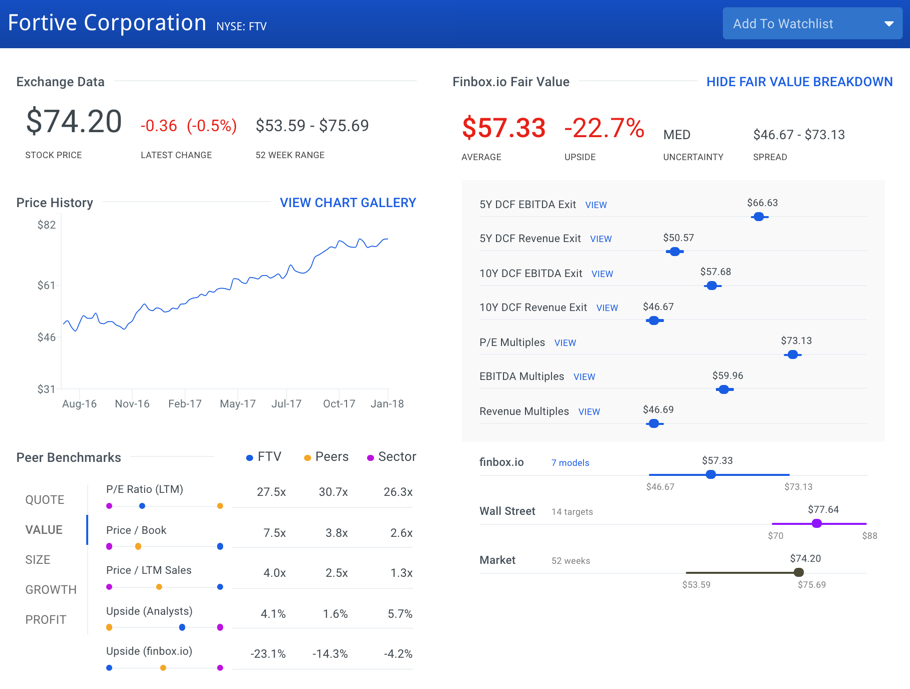
Shares of the company are trading 37.4% higher year over year. But the stock price could end up trading -22.7% lower in 2018 based on Fortive's future cash flow projections.
The 10 Most Expensive Stocks In The S&P 500: Coca-Cola
Coca-Cola (NYSE: KO) manufactures and distributes various nonalcoholic beverages worldwide. Coca-Cola sells its products primarily under the Coca-Cola, Diet Coke, Coca-Cola Zero, Fanta, Sprite, Minute Maid, Powerade, Schweppes, Dasani, Simply, and Glacéau Vitaminwater brand names. The company offers its beverage products through a network of company-owned or controlled bottling and distribution operators, as well as through independent bottling partners. The company was founded in 1886 and is headquartered in Atlanta, Georgia.
This massive beverage company is most often compared to Dr Pepper Snapple (NYSE: DPS), Constellation Brands (NYSE: STZ.B), Coca-Cola European (NYSE: CCE) and Pepsico (NYSE: PEP).
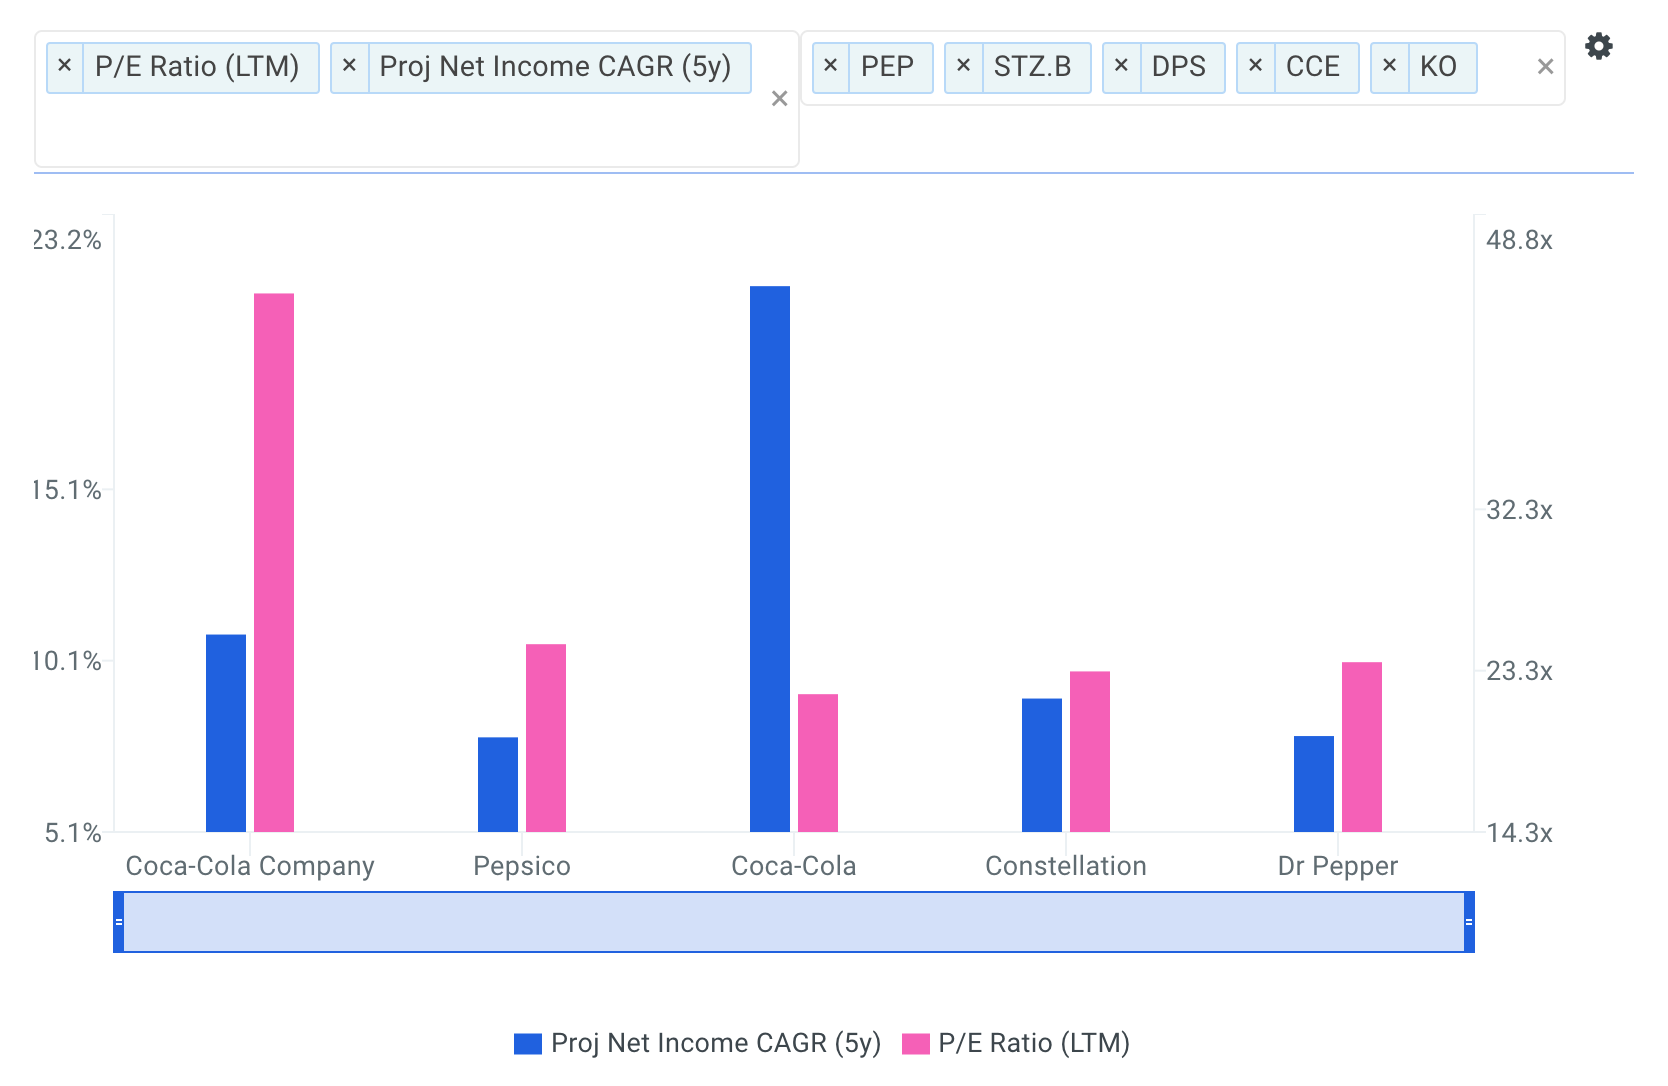
Although Coca-Cola's expected growth is in line with this peer group, the company's P/E multiple of 44.3x is well above DPS (23.8x), STZ.B (23.2x), CCE (22.0x) and PEP (24.8x). Coca-Cola is a quality business but simply looks expensive at current prices.
Source: finbox.io
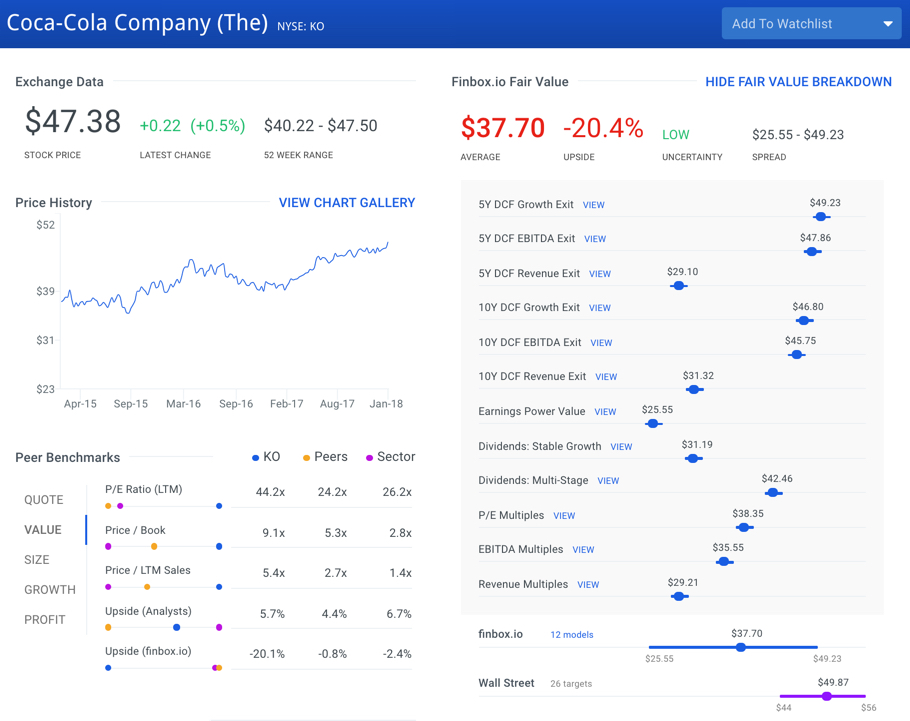
Coca-Cola's stock currently trades at $47.38 per share as of Monday January 22, up 18.0% over the last year. On a fundamental basis, the company's stock is trading at a -20.4% premium to finbox.io's intrinsic value estimate.

As of this writing, I did not hold a position in any of the aforementioned securities and this is not a buy or sell recommendation on any security mentioned.
Author: Matt Hogan
Expertise: Valuation, financial statement analysis
Matt Hogan is a co-founder of finbox.io. His expertise is in investment decision making. Prior to finbox.io, Matt worked for an investment banking group providing fairness opinions in connection to stock acquisitions. He spent much of his time building valuation models to help clients determine an asset’s fair value. He believes that these same valuation models should be used by all investors before buying or selling a stock.
His work is frequently published at InvestorPlace, Benzinga, ValueWalk, AAII, Barron's, Seeking Alpha and investing.com.
Matt can be reached at [email protected].


