
I Dream of Dividends
The goal of this screen is to find stocks with strong fundamentals and high dividend yields.
You can view the latest results here: Screen: I Dream of Dividends
Filters
In this section, I'll summarize the key filters used in the default I Dream of Dividends screen:
- Dividend Yield between 3% to 10%
- Return on Invested Capital > 10%
- P/E Ratio (LTM) > 0x
- Revenue > $100 million
Filter 1: Dividend Yield
Dividend Yield represents cash returned to shareholders for each dollar invested. Dividend yield is calculated as follows:
Dividend Yield = (Last Dividend * 4) / Stock Price
I only wanted to include companies that pay dividends:

To get guidance on threshold to use, I used the STAT BY SECTOR button. At the time of this writing (July 27, 2016), most sectors had a median Dividend Yield around ~1.5% - 2.0%:

Filter 2: Return on Invested Capital
Return on Invested Capital (ROIC) is used to evaluate the ability of the company to create value for all its stakeholders, debt and equity.
ROIC = NOPAT / Average Invested Capital
where NOPAT is defined as Net Operating Profit After Tax and Average Invested Capital is the average Debt + Equity over the same time-period. I only wanted to include companies with strong ROIC in my results:

Filter 3: P/E Ratio (LTM)
P/E Ratio (LTM), also knows as P/E Ratio, measures a company's current stock price relative to its per-share earnings. I wanted to exclude any companies that are unprofitable on a Net Income basis:

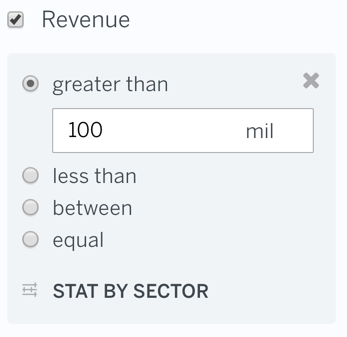
Filter 4: Revenue
Revenue represents the sales over the last twelve months. I wanted to exclude any companies that were below a certain size (< $100 million in LTM Revenue):
Downloading Results
Once the screen returns the relevant matches, you can either research the individual names further or create a portfolio based on the results.
To add any match to your Watchlist, just click the icon:

You can also Save the screen run again at a later time or Download all the matching results:

