Stock Screen: Cash is King!
The goal of this screen is to find strong defensive stocks that have plenty of liquidity and strong fundamentals.
You can view the latest results here: Screen: Cash is King
Filters
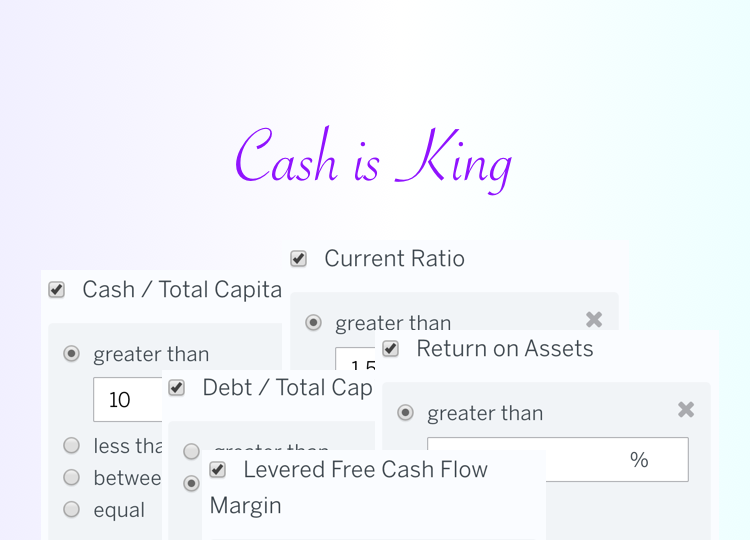
In this section, I'll summarize the key filters used in the default Cash is King! screen:
- Cash / Total Capital > 10%
- Current Ratio > 1.5x
- Debt / Total Capital < 10%
- Return on Assets > 10%
- Levered Free Cash Flow Margin > 10%
Filter 1: Cash / Total Capital
Cash / Total Capital measures a company's the amount of cash on hand in the current capital structure.
Cash / Total Capital = Cash / (Debt + Market Cap)
Companies with high cash balances are better equiped to survives business and economic cycles so I wanted Cash / Total Capital to be greater than 10%:
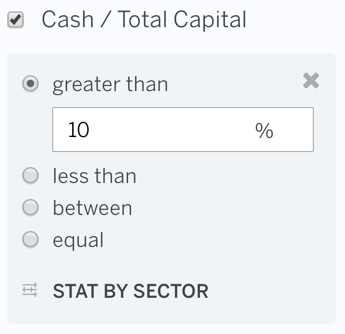
To get guidance on threshold, I used the STAT BY SECTOR button. At the time of this writing (July 27, 2016), the median company in each sector maintained between 1% - 9% Cash / Total Capital:

Filter 2: Current Ratio
Current Ratio measures whether a firm is capitalized with enough assets to pay its debts over the next twelve months by comparing a firm's Current Assets to its Current Liabilities.

Filter 3: Debt / Total Capital
Debt / Total Capital measures a company's current capital structure, financial solvency, and degree of leverage.
Debt / Total Capital = Debt / (Debt + Market Cap)
Companies with a lot of debt to service may come under pressure in a downturn. I wanted to exclude any companies with more debt than cash on hand:

Filter 4: Return on Assets
Return on Assets represents the dollars in Net Income a company generates per dollar of Assets. This criterion filters out companies that are not profitable.

Filter 5: Levered Free Cash Flow Margin
Levered Free Cash Flow Margin (LFCF Margin) represents a company's cash flows after interest payments on outstanding debt as a percent of Total Revenue. These cash flows are typically retained by the company or distributed to shareholders in the form of dividends. I wanted to surface companies with strong LFCF Margins so I added the following filter:

Downloading Results
Once the screen returns the relevant matches, you can either research the individual names further or create a portfolio based on the results.
To add any match to your Watchlist, just click the icon:

You can also Save the screen run again at a later time or Download all the
matching results:

