
Stock Screen: Bottom Hunter
The goal of this screen is to discover companies that may be near their bottom and ready for a rebound in price given their strong fundamentals.
You can view the latest results here: Screen: Bottom Hunter
Filters
In this section, I'll summarize the key filters used in the default Bottom Hunter screen:
- % of 52 Week Low < 150%
- Debt / Total Capital = 0%
- EV / Fwd EBITDA < 15x
- EV / Fwd Revenue < 3x
- Revenue CAGR (3y) > 5%
- Adj EBITDA Margin > 0%
Filter 1: % of 52 Week Low
% of 52 Week Low is defined as:
% of 52 Week Low = Stock Price / 52 Week Low
52 Week Low represents the lowest trade price for the company's stock in the past 52 weeks. Here's the default filter:
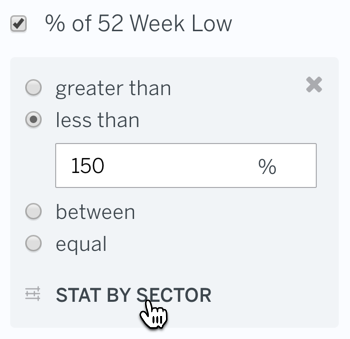
To get guidance on threshold to use, I used the STAT BY SECTOR button. At the time of this writing (July 27, 2016), most sectors were trading around 150% of their 52 Week Low:

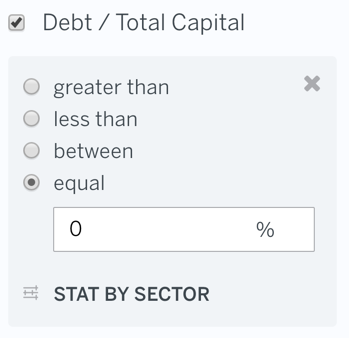
Filter 2: Debt / Total Capital = 0%
Debt / Total Capital measures a company's current capital structure, financial solvency, and degree of leverage.
Debt / Total Capital = Debt / (Debt + Market Cap)
Since companies are trading near their 52 Week Low may be in trouble, I wanted to remove companies with any bankruptcy risk to give management enough runway to recover. Here's the default filter:
Filter 3: EV / Fwd EBITDA < 15x
EV/EBITDA is calculated by dividing Enterprise Value by EBITDA is often used to benchmark the fair market value of a company. I wanted companies trading a reasonable multiple (< 15x):

Filter 4: EV / Fwd Revenue < 3x
EV/EBITDA is calculated by dividing Enterprise Value by Revenue. I wanted companies that have sufficient revenue and are trading at a reasonable multiples (< 3x):

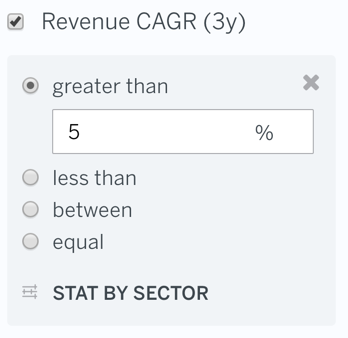
Filter 5: Revenue CAGR (3y) > 5%
Revenue CAGR (3y) represents the average annual growth rate of revenue over a three year period. It's calculated as follows:
3yr CAGR = [ Revenue FY+3 / Revenue FY ] ^ (1/3 years) - 1
where FY = Fiscal Year and FY+3 = Fiscal Year three years from now.
I wanted companies that have healthy revenue growth (> 5%) desipte the pull back in stock price:
Filter 6: Adj EBITDA Margin > 0%
EBITDA, Earnings before Interest, Taxes, Depreciation, and Amortization is a common measure of profitability. I wanted to weed out any stocks that aren't profitable on an EBITDA basis since that usually a sign of deeper troubles:

Downloading Results
Once the screen returns the relevant matches, you can either research the individual names further or create a portfolio based on the results.
To add any match to your Watchlist, just click the icon:

You can also Save the screen run again at a later time or Download all the matching results:


