
Stock Screen: Ben Graham Formula
The goal of this screen is to find companies that have strong upside based on the Ben Graham valuation formula
You can view the latest results here: Screen: Ben Graham Formula
About the Ben Graham Valuation formula
The Ben Graham Formula is a simple method for estimating the intrinsic value of a company. It was proposed by Benjamin Graham in his world famous book the Intelligent Investor.
The formula he proposed can be summarized as follows:
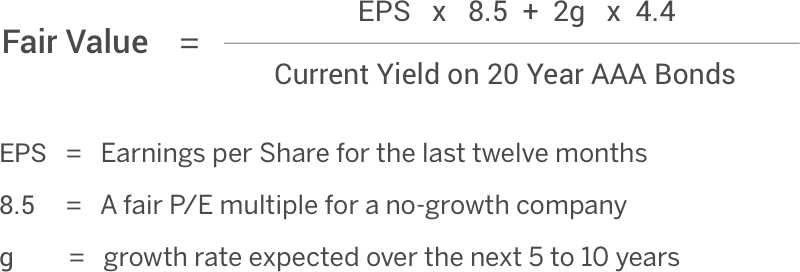
Filters
In this section, I'll summarize the key filters used in the default Ben Graham Formula screen.
- Ben Graham Formula Upside > 0%
- Upside (Analyst Target) between 20% and 75%
- Return on Invested Capital > 0%
- Market Capitalization > $250 million
Filter 1: Ben Graham Upside
finbox.io makes it easy to find stocks that have strong upside potential based on the Ben Graham Formula (BGF) value. You can find stocks trading below their intrinsic value using Ben Graham Formula Upside filter:

I wanted to view companies trading below BGF intrinsic value (> 0% Upside). Here's the default filter:

We recommend adding additional filters to uncover the best results. The default screen uses Upside (Analyst Target), Return on Invested Capital, and Market Capitalization as additional filters. You can easily adjust these to your liking!
Filter 2: Upside (Analyst Target)
Upside (Analyst Target) represents the upside potential of the stock based on the average price target of stock analysts that typically work at investment banks or equity research firms.
I've selected an upside range of 20% to 75% to exclude any companies that analysts are overly optimistic about (< 75% Upside) but still have rich upside (> 20% Upside)
Here's the default filter:

Use the STAT BY SECTOR button to get guidance on threshold to use:

Filter 3: Return on Invested Capital
Return on Invested Capital (ROIC) is used to evaluate the ability of the company to create value for all its stakeholders, debt and equity.
ROIC = NOPAT / Average Invested Capital
where NOPAT is defined as Net Operating Profit After Tax and Average Invested Capital is the average Debt + Equity over the same time-period.
I'm using it in this screen to weed out companies that aren't profitable on a NOPAT basis. Here's what the default filter looks like in action:

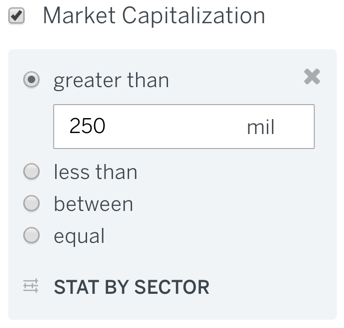
Filter 4: Market Capitalization
Market Capitalization is a public company's total equity value as implied by the stock's last observed trading price. In this screen, I'm using it to weed out companies that are below a certain size (< $250 million).
Here's the default filter:
Sorts
To bring the strong candidates to the top, I've applied a sort based on Ben Graham Formula Upside:

Downloading Results
Once the screen returns the relevant matches, you can either research the individual names further or create a portfolio based on the results.
To add any match to your Watchlist, just click the icon:

You can also Save the screen run again at a later time or Download all the matching results:

