Strong Altman Z-Scores
The goal of this screen is to find stocks with strong Altman Z-scores (credit risk indicator), positive cash flow, and increasing profits.
You can view the latest results here: Screen: Strong Altman Z-Scores
About the Altman Z-Score
The Altman Z-Score estimates the risk of bankruptcy within the next two years for a company. The methodology to calculate a Altman Z-Score is based on research published by Edward Altman in 1968. Edward Altman is a renowned Finance professor at NYU's Stern School of Business. A company's Z-Score is calculated using metrics derived from its Income Statement and Balance Sheet.
The formula can be summarized as follows:
Altman Z-Score =
       1.2  x  Working Capital / Total Assets
  (+)  1.4  x  Retained Earnings / Total Assets
  (+)  3.3  x  Earnings Before Interest and Taxes / Total Assets
  (+)  0.6  x  Market Capitalization / Total Liabilities
  (+)  1.0  x  Total Revenue / Total Assets
Working Capital / Total Assetsmeasures the liquidity of the company's assets
with respect to the size of the companyRetained Earnings / Total Assetsis used as an indicator of past
profitability, company age, and profit potentialEarnings Before Interest and Taxes / Total Assetsmeasures the current
profitability and asset efficiency of the companyMarket Capitalization / Total Liabilitiesmeasures the amount of leverage
based on the company's future profit potential and the value ascribed to its equity
in the current economic environmentTotal Revenue / Total Assetsadditional measure of current
profitability and asset efficiency
Interpreting the Altman Z-Score
A company is considered to be in the Safe Zone if it scores greater than 2.99. If a company scores between 1.81 and 2.99, it's considered to be in the Gray Zone while a score below 1.81 is considered Distress Zone.
Filters
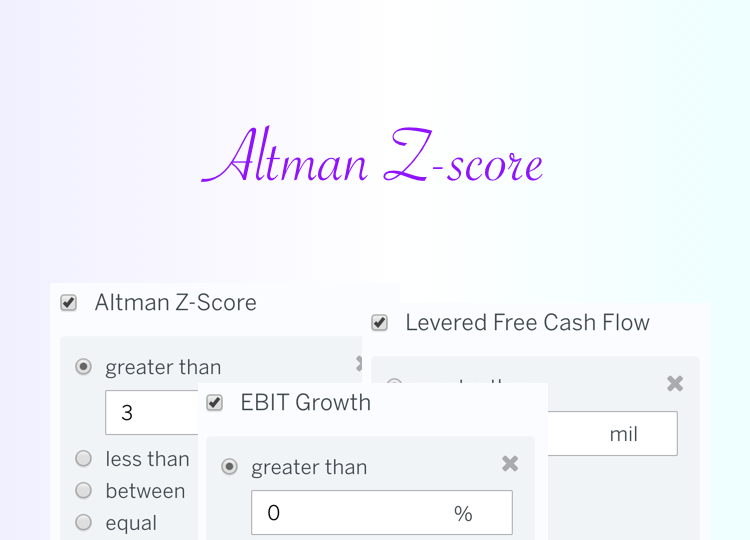
In this section, I'll summarize key filters used in the default Strong Altman Z-Scores screen:
- Altman Z-Score > 3
- Levered Free Cash Flow > $0 million
- EBIT Growth > 0
Filter 1: Altman Z-Score
finbox.io makes it easy to find stocks that have strong Altman Z-Scores. You simply need to add the Altman Z-Score filter:

Filter 2: Levered Free Cash Flow
Levered Free Cash Flow (LFCF) represents a company's cash flows after interest payments on outstanding debt. These cash flows are typically retained by the company or distributed to shareholders in the form of dividends. I wanted to exclude companies with negative LFCF so I added the following criteria:

Filter 3: EBIT Growth
EBIT is a common measure of profitability and stands of Earnings before Interest and Taxes. I wanted to exclude any companies with declining profitability:

Downloading Results
Once the screen returns the relevant matches, you can either research the individual names further or create a portfolio based on the results.
To add any match to your Watchlist, just click the icon:

You can also Save the screen run again at a later time or Download all the matching results:

