Huntsman Corporation (NYSE: HUN) trades at an EBITDA multiple of 7.4x, which is lower than the Materials sector median of 9.9x. While this makes HUN appear like a stock to add to your portfolio, you might change your mind after gaining a better understanding of the assumptions behind the EV/EBITDA ratio. In this article, I will break down what an EBITDA multiple is, how to interpret it and what to watch out for.
How To Utilize EBITDA Multiples
A Multiples Valuation, also known as a Comparable Companies Analysis, determines the value of a subject company by benchmarking the subject's financial performance against similar public companies (Peer Group). We can infer if a company is undervalued or overvalued relative to its peers by comparing metrics like growth, profit margin, and valuation multiples.
An EBITDA Multiple, also known as Enterprise Value-to-EBITDA Multiple (EV/EBITDA), measures the dollars in Enterprise Value for each dollar of EBITDA. To determine if a company is expensive, it's far more useful to compare EV/EBITDA multiples than the absolute stock price. Furthermore, its key benefit over the P/E multiple is that it's capital structure-neutral, and, therefore, better at comparing companies with different levels of debt. The general formula behind an EBITDA Multiples valuation model is the following:
Enterprise Value = EBITDA x Selected Multiple
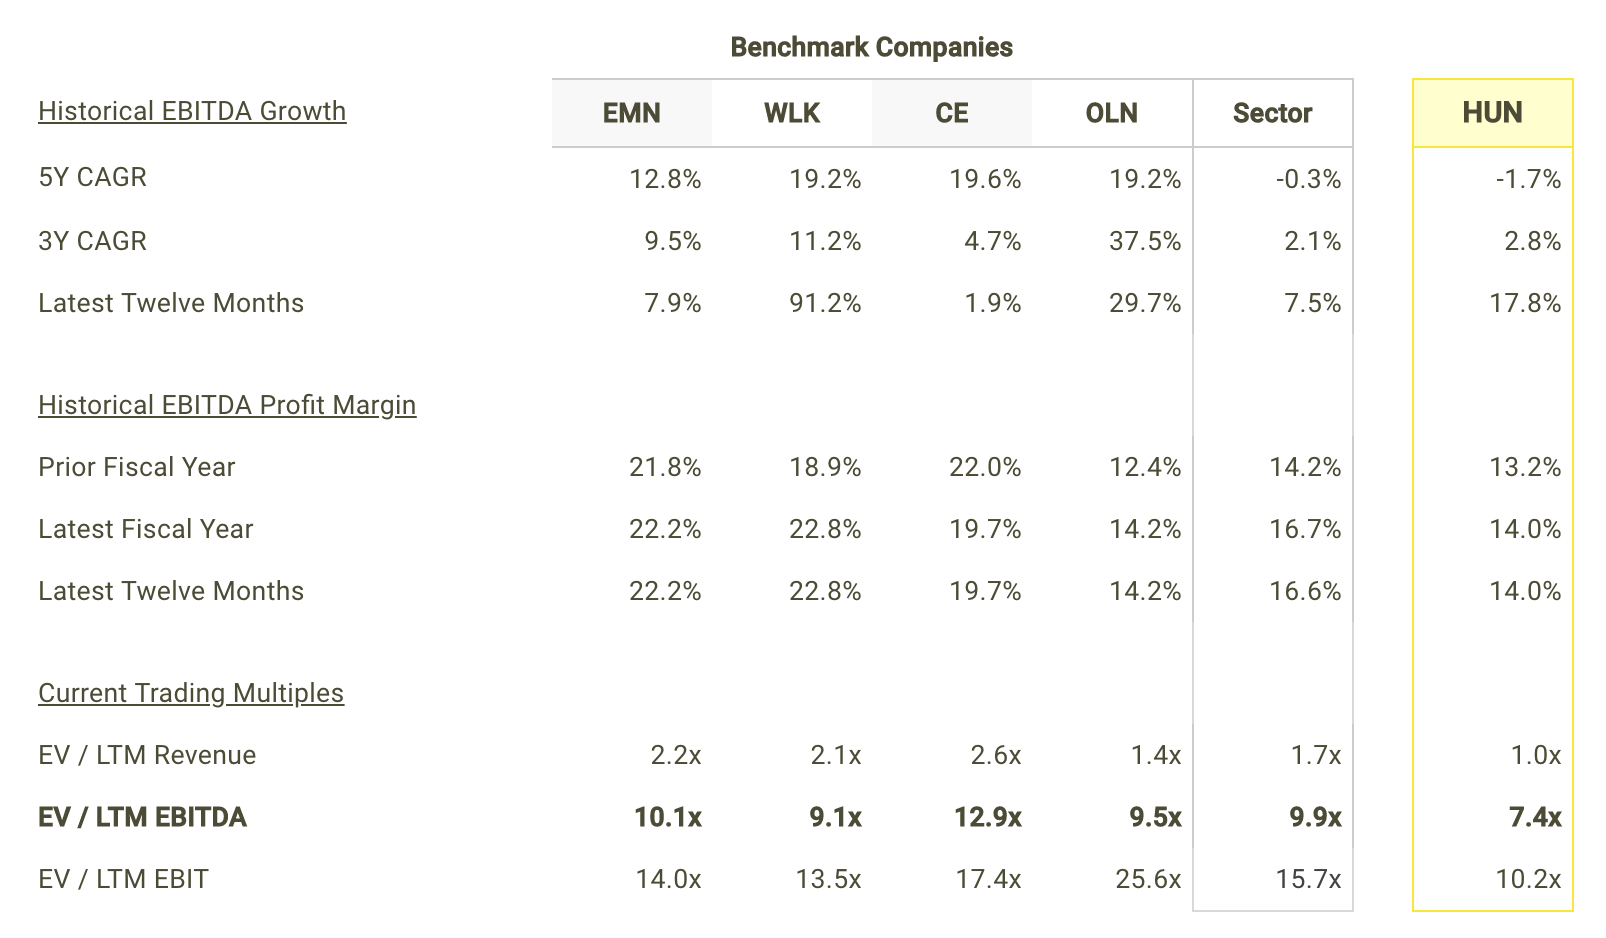
An EBITDA multiple is not meant to be viewed in isolation and is only useful when comparing it to other similar companies. Since it is expected that similar companies have similar EV/EBITDA ratios, we can come to some conclusions about the stock if the ratios are different. I compare Huntsman's EBITDA multiple to those of Eastman Chemical Company (NYSE: EMN), Westlake Chemical Corporation (NYSE: WLK), Celanese Corporation (NYSE: CE) and Olin Corporation (NYSE: OLN) in the chart below.
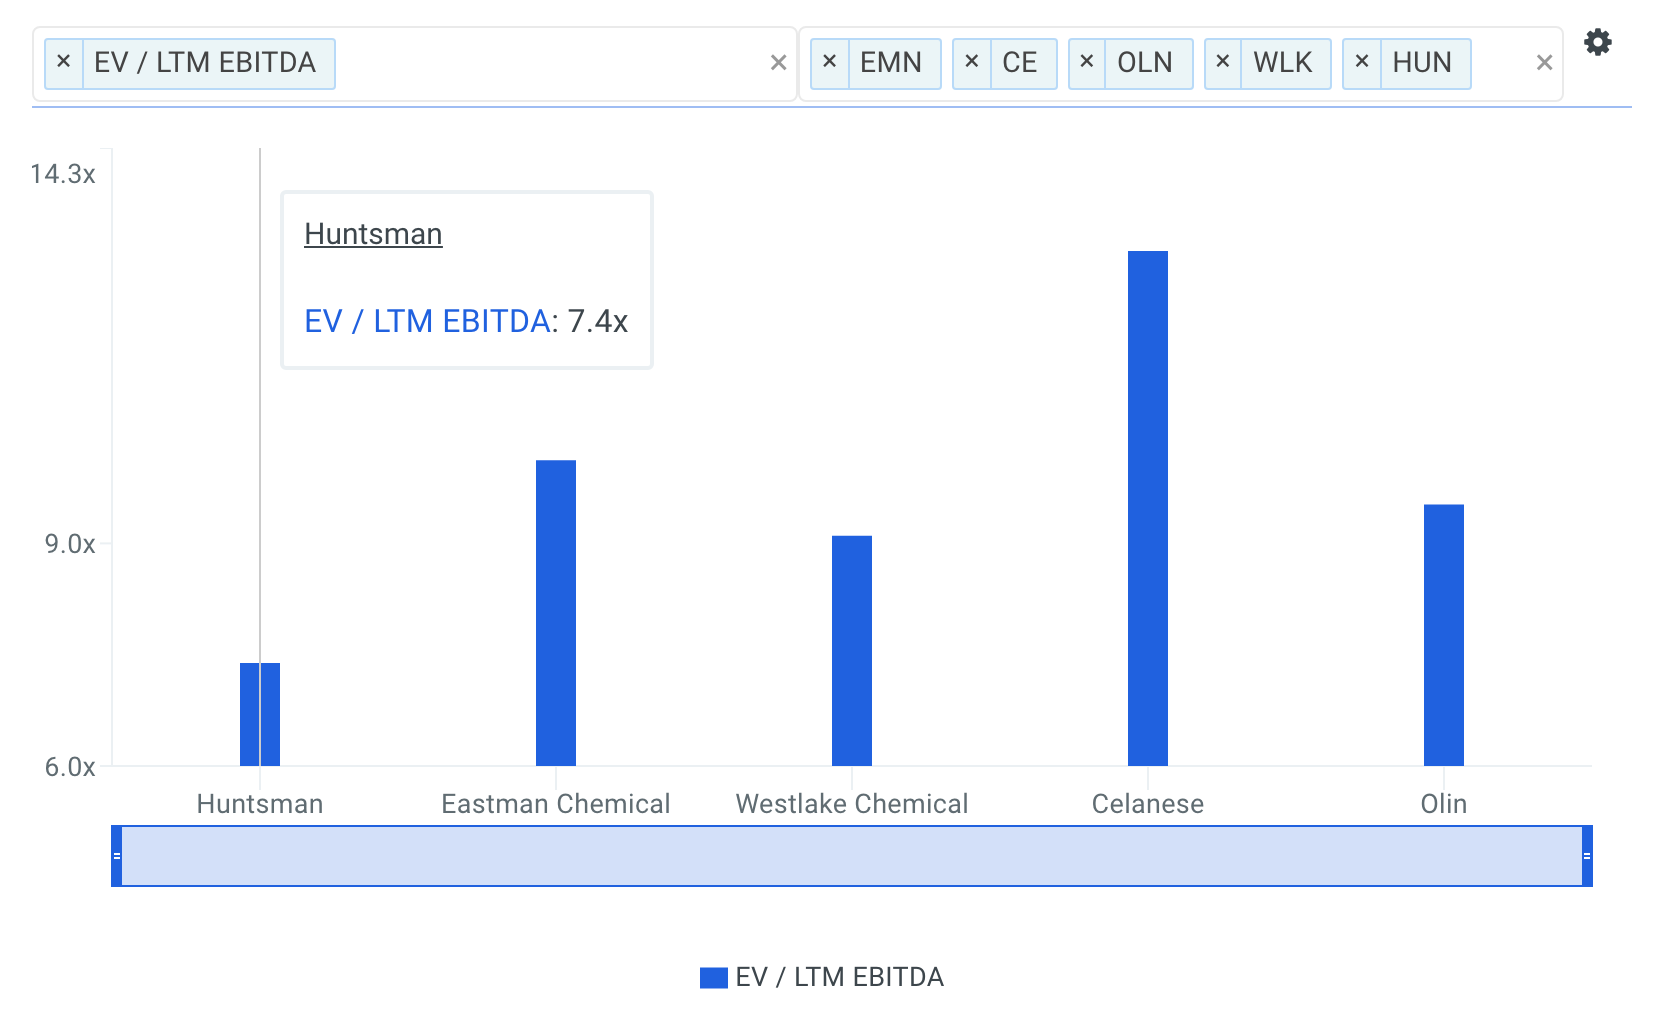
source: finbox.io Benchmarks: EBITDA Multiples
Since Huntsman's EV/EBITDA of 7.4x is lower than the median of its peers (9.8x), it means that investors are paying less than they should for each dollar of HUN's EBITDA. As such, our analysis shows that HUN represents an undervalued stock. In fact, finbox.io's EBITDA Multiples Model calculates a fair value of $35.79 per share which implies 26.6% upside.
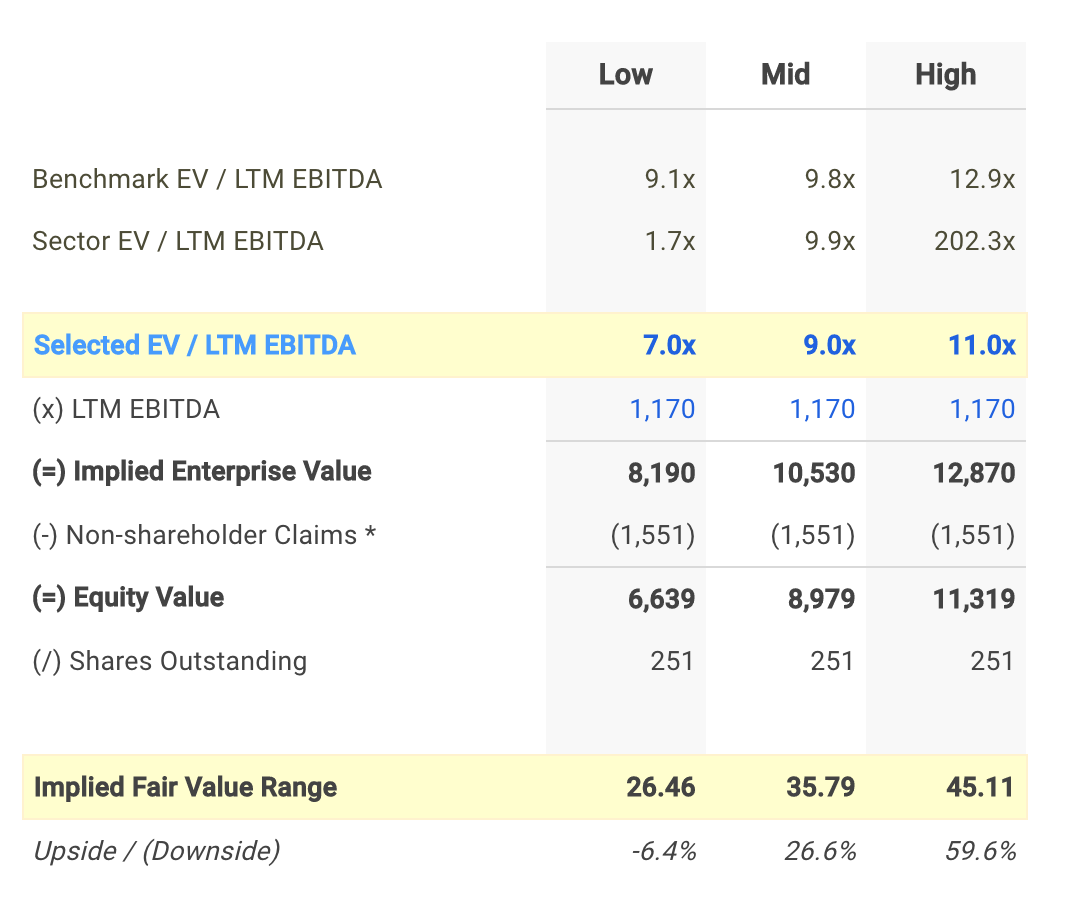
Note that the selected multiple of 9.0x in the analysis above was determined by averaging Huntsman's current EBITDA multiple with its peer group and sector.
EBITDA Multiple's Limitations
Before jumping to the conclusion that Huntsman should be added to your portfolio, it is important to understand that our conclusion rests on two important assumptions.
(1) the selected peer group actually contains companies that truly are similar to Huntsman, and
(2) the selected peer group stocks are being fairly valued by the market.
If the first assumption is not accurate, the difference in EBITDA multiples could be due to a variety of factors. For example, if you accidentally compare Huntsman with higher growth companies, then its EBITDA multiple would naturally be lower than its peers since investors reward high growth stocks with a higher price.
source: EBITDA multiples model
Now if the second assumption does not hold true, Huntsman's lower multiple may be because firms in our peer group are being overvalued by the market.
What This Means For Investors
As a shareholder, you may have already conducted fundamental analysis on the stock so its current undervaluation could signal a potential buying opportunity to increase your position in HUN. However, keep in mind the limitations of an EBITDA multiples valuation when making an investment decision. There are a variety of other fundamental factors that I have not taken into consideration in this article. If you have not done so already, I highly recommend that you complete your research on Huntsman by taking a look at the following:
Efficiency Metrics: is management becoming more or less efficient over time? Find out by analyzing the company's asset turnover ratio which measures the dollars in revenue a company generates per dollar of assets.
Risk Metrics: what is Huntsman's cash ratio which is used to assess a company's short-term liquidity. View the company's cash ratio here.
Valuation Metrics: what is Huntsman's free cash flow yield and how does it compare to its publicly traded peers? This metric measures the amount of free cash flow for each dollar of equity (market capitalization). Analyze the free cash flow yield here.
Author: Andy Pai
Expertise: financial modeling, mergers & acquisitions
Andy is also a founder at finbox.io, where he's focused on building tools that make it faster and easier for investors to do investment research. Andy's background is in investment banking where he led the analysis on over 50 board advisory engagements involving mergers and acquisitions, fairness opinions and solvency opinions. Some of his board advisory highlights:
- Sears Holdings Corp.'s $620 mm spin-off via rights offering of Sears Outlet, Hometown Stores and Sears Hardware Stores.
- Cerberus Capital Management's $3.3 bn acquisition of SUPERVALU Inc.'s New Albertsons, Inc. assets.
Andy can be reached at [email protected].
As of this writing, I did not hold a position in any of the aforementioned securities and this is not a buy or sell recommendation on any security mentioned.


%20At%20This%20EBITDA%20Multiple%3F)