With September in the books, it’s time to see how well finbox.io fair value estimates performed relative to the market...
- There were 2,002 stocks with a
LOWfair value uncertainty rating as of September 1st. Find out how we determine uncertainty here. - These stocks were segmented into five groups based on their calculated margin of safety as of September 1st.
- Group returns were computed by equally weighting each stock.
September returns for each of the five groups compared to the S&P 500, Dow Jones and Nasdaq are shown below.
<img src='http://res.cloudinary.com/finbox/image/upload/v1475513602/Returns_-_All_z1epss.jpg' alt= ‘September Fair Value Returns’>
As expected the 339 stocks with 25% or greater upside (aka margin of safety) realized the highest returns (1.2%) among the five groups.
However, the results are more interesting when grouping stocks by their size or Market Capitalization.
Large & Mid Cap Stocks vs S&P 500
There were 967 stocks (of the 2,002) that had a market cap greater than $2 billion. September returns for these stocks were benchmarked against the S&P 500 as shown below.
<img src='http://res.cloudinary.com/finbox/image/upload/v1475513607/Returns_-_Large_Mid_Cap_i1f0l5.jpg' alt= ‘September Fair Value Returns - Large & Mid Cap Stocks’>
The 81 stocks with 25% or more margin of safety returned 2.3% in September compared to the S&P 500's -0.1%... a difference of 2.4%!
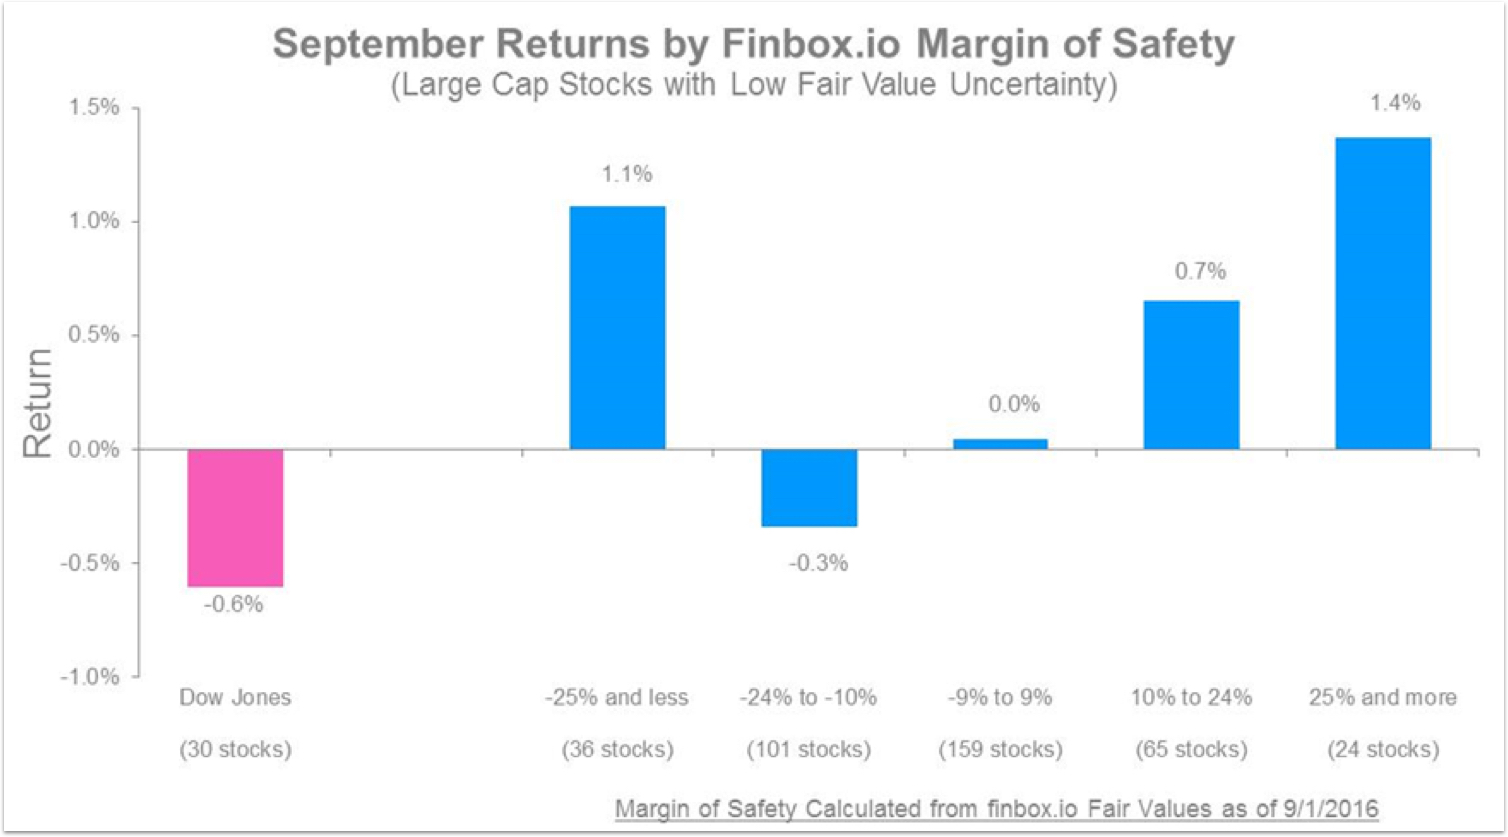
Large Cap Stocks vs Dow Jones
There were 385 stocks (of the 2,002) that had a market cap greater than $10 billion. September returns for these stocks relative to the Dow Jones Industrial Index are shown below.
<img src='http://res.cloudinary.com/finbox/image/upload/v1475513606/Returns_-_Large_Cap_pflb8h.jpg' alt= ‘September Fair Value Returns - Large Cap Stocks’>
The 24 stocks with 25% or more margin of safety returned 1.4% in September compared to the Dow's -0.6%... a difference of 2.0%.
Small Cap Stocks vs Nasdaq
There were 675 stocks (of the 2,002) that had a market cap between $300 million and $2 billion. September returns for these stocks are shown below.
<img src='http://res.cloudinary.com/finbox/image/upload/v1475513607/Returns_-_Small_Cap_djrwpm.jpg' alt= ‘September Fair Value Returns - Small Cap Stocks’>
September returns for the 142 stocks with the highest margin of safety were generally in line with the Nasdaq.
Each small cap group improved by over 1% in September. Interestingly, the 53 stocks with the least margin of safety actually realized the highest returns over the period.
Small cap stocks typically having less liquidity relative to larger cap stocks. So this result is not entirely surprising as it will likely take longer for these stocks to track their underlying fundamentals. However, it’s an interesting story line that we’ll keep an eye on in October.
Concluding Remarks
Stocks with the highest margin of safety as calculated on September 1st realized superior returns compared to the market. Our most undervalued mid and large cap stocks outperformed the S&P 500 by 2.4%.
However, there was an interesting development in September related to our most overvalued stocks (-25% or less margin of safety). Specifically in the large cap and small cap group which realized returns of 1.1% and 1.6%, respectively. It will be interesting to see if these two groups begin to track their fair value estimates in October.
Get Started Now!
Disclaimer:
Finbox.io fair value estimates are not intended to be soley relied upon. They are intended to be a starting point for fundamental analyst’s investment research.

