![Sensitivity Analysis In Excel: Tutorial, Example [+ Template]](https://storage.googleapis.com/finbox-blog/2020/05/sensitivity-analysis-in-Excel-image.PNG)
Do you want to perform a sensitivity analysis in excel but you don't know how? Don't worry, you've come to the right place. In this article, you will learn how to conduct a sensitivity analysis in excel with a detailed step-by-step guide.
What's more, I've prepared for you a sensitivity analysis template both for Excel and Google Sheets. You will find the link to download them for free at the end of the article.
Before we start the guide, let's go over the basics of sensitivity analysis. Are you ready? Let's start.
What is Sensitivity Analysis?
If you are an investor, you already know that most of our investment decisions are based on future estimates. For example, while evaluating the intrinsic value of a business, we estimate the future cash flows it can generate based on several assumptions such as revenue growth, tax rate, EBIT margin, and so on.
The question is: What happens to the intrinsic value of the business if one of our assumption changes?
This is where sensitivity analysis comes in and this is why it is also known as what-if analysis. It is an analytical tool that lets you assess how a dependent variable (in this case, the intrinsic value of the stock) changes if you alter one or more independent variables (revenue growth, tax rate, and so on).
A two-way sensitivity analysis occurs if you vary the value of two input variables, while in the one-way sensitivity analysis, you change the value of just one input.
If it's still not 100% clear, It'll be with an example!
Sensitivity Analysis Example
Exactly 2 months ago, I published an [analysis](https://seekingalpha.com/article/4332831-fresenius-strong-buy-after-65-sell-off" target="_blank) of Fresenius ([DB:FRE](https://finbox.com/DB:FRE" target="_blank)) where I performed a two-way sensitivity analysis to evaluate how a change in my assumptions would have affected the internal rate of return of the investment.
The variables where the exit multiple and the tax rate.
The exit multiple is used to calculate the terminal value of a business while performing a discounted cash flow analysis. Even if we carefully select the ratio value with the appropriate methods (past trend, industry average, peers, etc.) it still is an arbitrary number that moves the needle in our model. For this reason, we should always check how a change in its value impacts our valuation.
Furthermore, I wanted to see how a change in the tax rate impacted my valuation because, as I wrote in the analysis "The 2020 Presidential Election that will be held this year could be an inflection point for the corporate tax rate," as you can read in [this report](https://www.dbresearch.com/PROD/RPS_EN-PROD/PROD0000000000502295/2020%3A_An_inflection_point_in_global_corporate_tax%3F.PDF" target="_blank) from Deutsche Bank.
This was the result of the sensitivity analysis in excel.
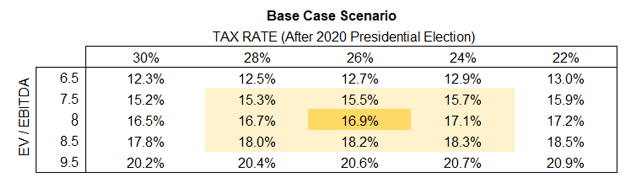
Source: Author's Analysis Of Fresenius (Published on 18 March 2020)
I hope this sensitivity analysis example made things clearer. Now we can move on to the step-by-step guide to sensitivity analysis in excel.
Sensitivity Analysis In Excel: A step-by-step tutorial
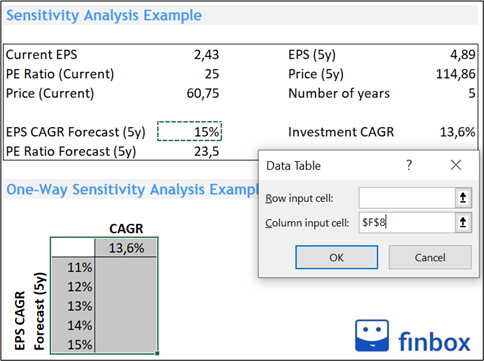
Let's say you're analyzing a growth stock with the following metrics:
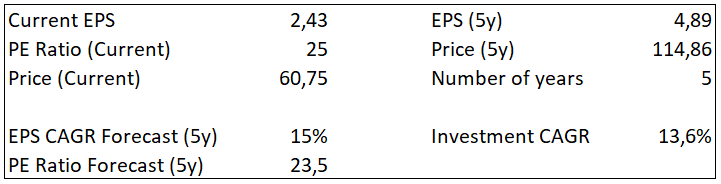
What this simple table tells you is that you'll obtain a 13,6% CAGR on your investment if the company's EPS grows by 15% per year for the following 5 years and its PE Ratio in 5 years will be 23,5.
A change in the EPS growth could significantly impact your investment return. For this reason, you decide that the best thing to do is to perform a one-way sensitivity analysis in excel.
One-Way Sensitivity Analysis In Excel
- Create a table like the one below. You have to insert your current CAGR in the column and the EPS Growth variations in the rows.
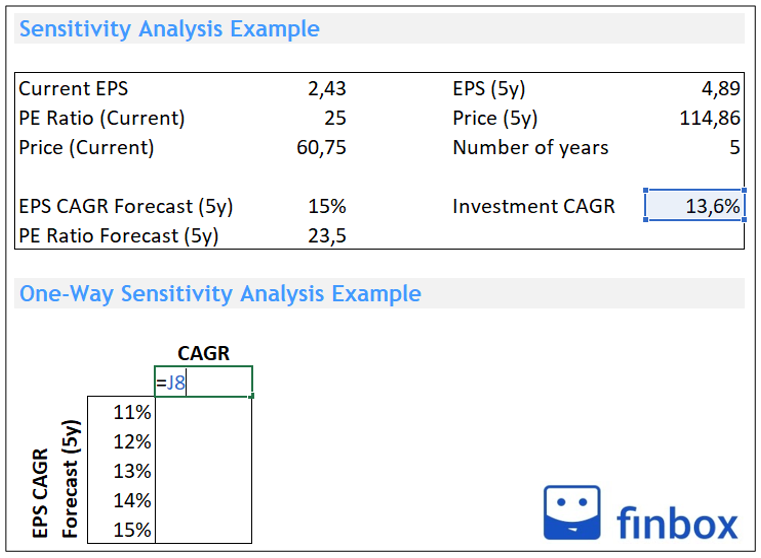
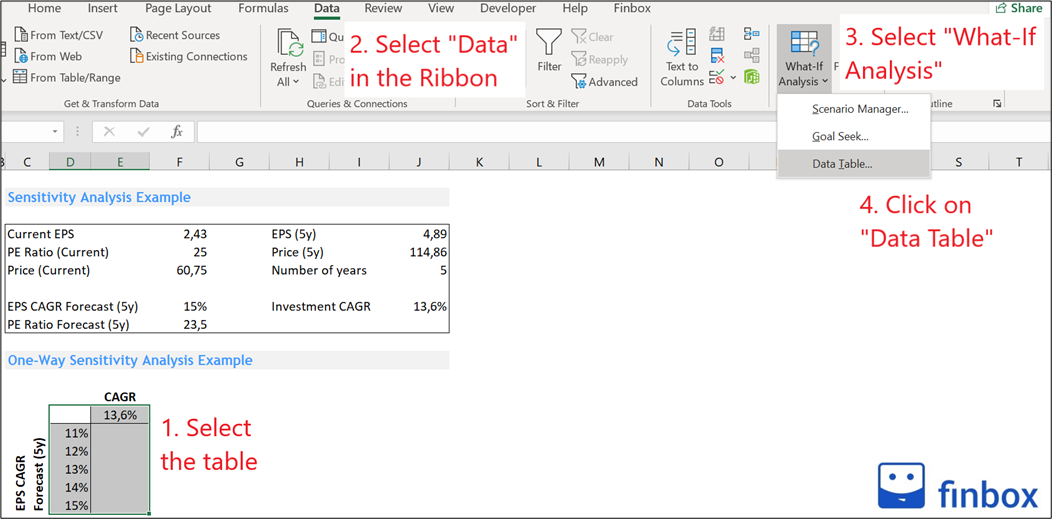
- Follow these steps to create a data table
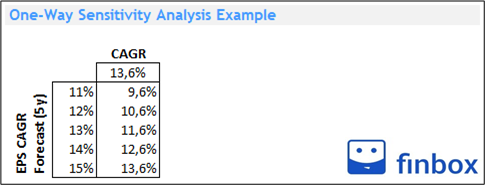
- Insert in the "Column Input Cell" the variable you want to analyze. We'll leave the "row input cell" empty because this is a one-way sensitivity analysis.
- You can now observe how your investment return changes based on the EPS growth.
Now that you've learned how to perform a one-way sensitivity analysis in excel, let's see how to conduct the two-way one.
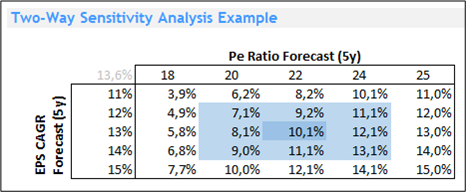
Two-Way Sensitivity Analysis In Excel
As we mentioned above, in the two-way sensitivity analysis we sensitize the output for two variables. Here's a step-by-step guide:
- Create a table like the one below. You have to insert the output you want to sensitize top-left, and then your variables in the adjacent column and row.
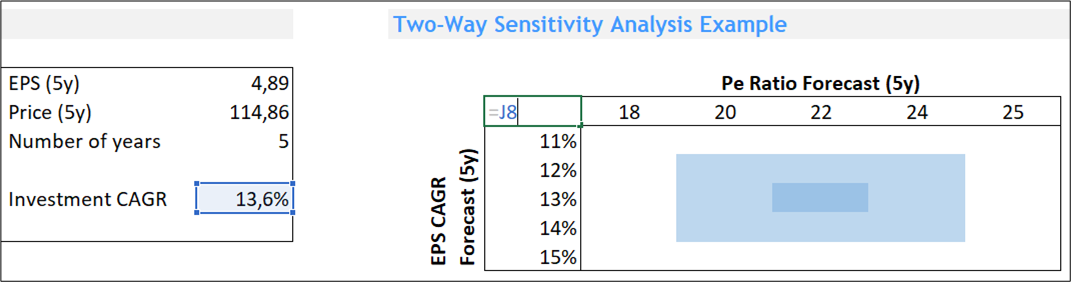
- Once you do that, select the table and follow the same process described earlier to create a data table.
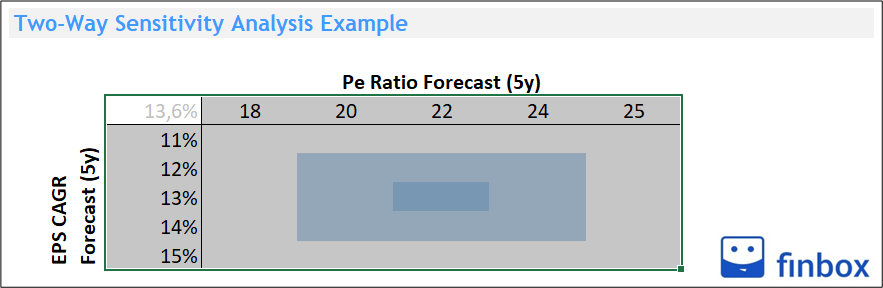
- This time we insert in the "row input cell" the F9 Cell (Pe Ratio Forecast) and the F8 cell (EPS Forecast) in the "column input cell".
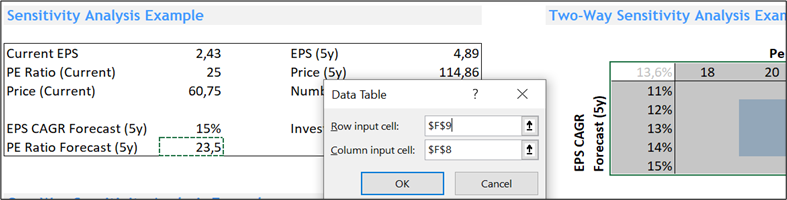
- You can now observe how your investment return varies based on changes in the EPS growth and the PE Ratio forecast.
Sensitivity Analysis: Excel & Google Sheets Template
It may be helpful to view the spreadsheet I got after the entire process. You can download it by clicking on the following links:
- [Excel](https://1drv.ms/x/s!ArJYyjekbCHppG1pKyat7Gem93H5?e=oz0nbt" target="_blank" target="_blank) Open the file, then click on File, Save As, Download a Copy
- [Google SpreadSheet](https://docs.google.com/spreadsheets/d/1_qRhEy3RaLvU1GhJTf2APQk0smw6TSdntc2wh66CAt8/edit?usp=sharing" target="_blank) Open the File, then click on File, Make a copy
[ ](https://finbox.com/integrations/excel" target="_blank)

