
Multiples Valuation: P/E Multiples
How to Build a P/E Multiples Comparable Company Analysis Model
A Multiples Valuation, also known as a Comparable Companies Analysis, determines the value of a subject company by benchmarking the subject's financial performance against similar public companies (Peer Group).
We can deduce if a company is undervalued or overvalued relative to its peers by comparing metrics like growth, profit margin, and valuation multiples. finbox.io offers pre-built Multiples Valuation models based on EBITDA, Revenue, and P/E. This guide will walk through the P/E Multiples Valuation model.
A P/E Multiple, also known as the Price-to-Earnings ratio, indicates the multiple of earnings investors are willing to pay for one share of a company. To determine if a company is "expensive" it is far more useful to compare P/E ratios (say 15x vs 20x) than the absolute stock price ($5/share vs $5,000/share). If you're not familiar with P/E ratios, I recommend reading Understanding the P/E Ratio on Investopedia first.
The formula behind a P/E Multiple model is the following:
Market Cap = Net Income x Selected Multiple
Once we've estimated Market Cap or Common Equity Value, we can divide it by Shares Outstanding to calculate Fair Value per Share
Here is an outline of the process:
- Step 1: Select Comparable Companies
- Step 2: Select LTM P/E Multiple
- Step 3: Select Forward P/E Multiple
- Step 4: Conclude on a Fair Value Range
I've created an Illustrative P/E Multiples model for Visa that you can use to follow along with this guide:
Google Spreadsheet of Multiples Valuation: P/E
You can also build your own updated model on finbox.io here.
Select Comparable Companies
Selecting a good peer group is critical in a Multiples Valuation analysis. When defining the Peer Group, it's important to understand the key characteristics of a company's operations. Good comparable companies generally operate in similar industries and have similar business models and operating metrics.
finbox.io has algorithms that select the default peer group but you can use sources like SEC filings, news, research reports, and your industry knowledge to customize the peer group.
To edit the default benchmark companies used in the model:
- On the
BENCHMARKS EDITORtab, click the EDIT BENCHMARKS button
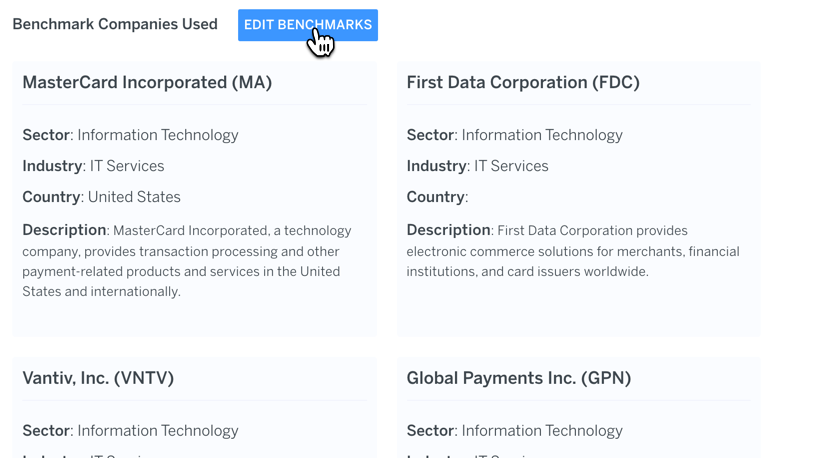
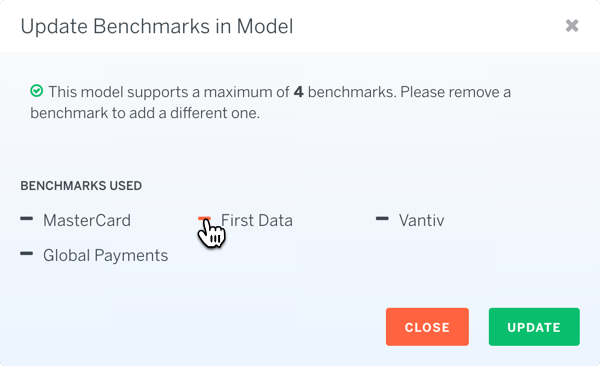
- Benchmarks are limited to 4 companies. You can remove an existing company by clicking the
--sign next to it. In my model I wanted to replace First Data with Western Union:
- Search for the company you would like to add:
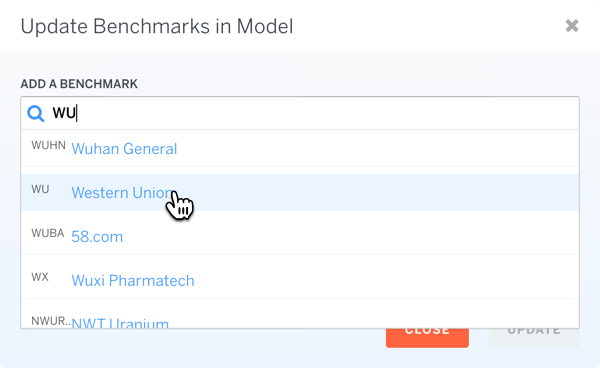
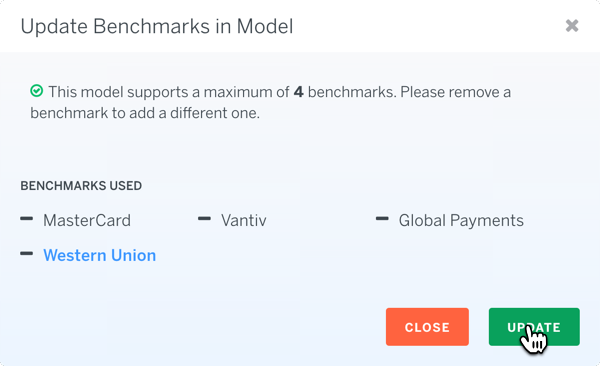
- Once you hit Update, your model will update with data for your new benchmarks
Select LTM P/E Multiple
The key question we're trying to answer in this step is the following -- are the differences in operating metrics like growth and margin in the peer group accurately reflected in the market P/E multiples?
To determine whether the subject company is being valued appropriately I like to first identify the "best" and the "worst" company in the peer group. Ranking the peer group from best to worst provides me with a range of valuation multiples that I can apply to the subject company.
Some questions worth exploring during this step:
- Which company has the best historical and projected growth profile?
- Which company has the best profit margins?
- Which company is the biggest?
- Which company has the best returns on invested capital?
- Do all companies have similar levels of debt? A company can look expensive
on a P/E basis just because it has more debt.
If all else is equal, higher quality businesses deserve higher valuation multiples. Questions like these can help you discern how the subject company ranks against the peer group. PE multiples are highly correlated with growth so differences in Net Income growth often explain differences in valuation.
The model has a table you can use to answer many of these questions:
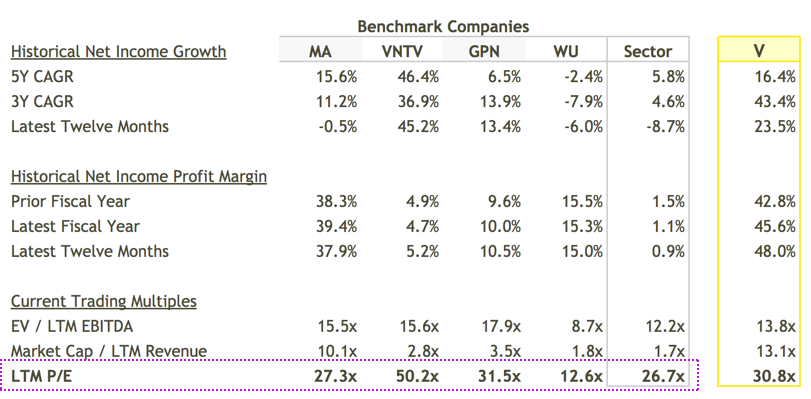
In the illustrative peer group (MasterCard (MA), Vantiv (VNTV), Global Payments (GPN), and Western Union (WU)), Western Union has the lowest historical Net Income growth and unsurprisingly trades at the lowest P/E multiple of 12.6x. Vantiv has delivered strong Net Income growth consistently and trades at the highest P/E multiple of 50.2x.
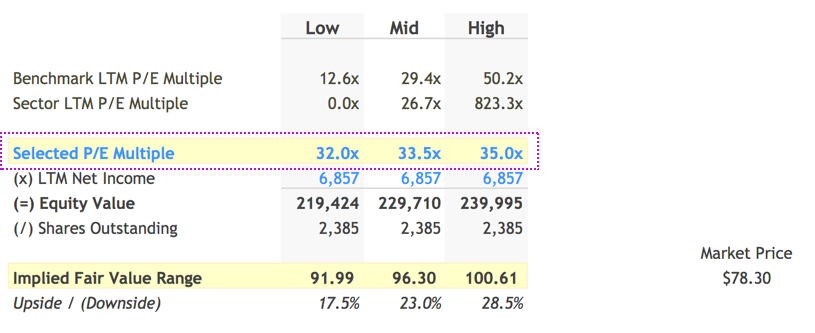
Given these data points, I valued Visa (V) between 32.0x to 35.0x times LTM Net Income, above MasterCard, Global Payments, and Western Union on the low-end but below Vantiv on the high-end. My selection implied a per share price range of $91.99 to $100.61, with a mid-point of $96.30.
Select Forward P/E Multiple
You can follow the same thought process discussed in the previous step to select a multiple based on projected or Forward Net Income.
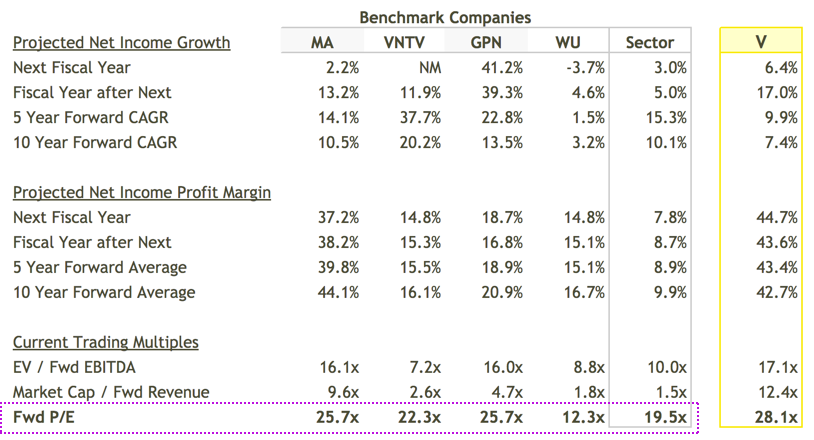
In the illustrative example, Global Payments (GPN) has the best growth outlook over the next two years - 41.2% and 39.3%. and commands a Fwd P/E multiple of 25.7x. Again, Western Union is at the bottom of the pack trading at a 12.3x Fwd P/E multiple.
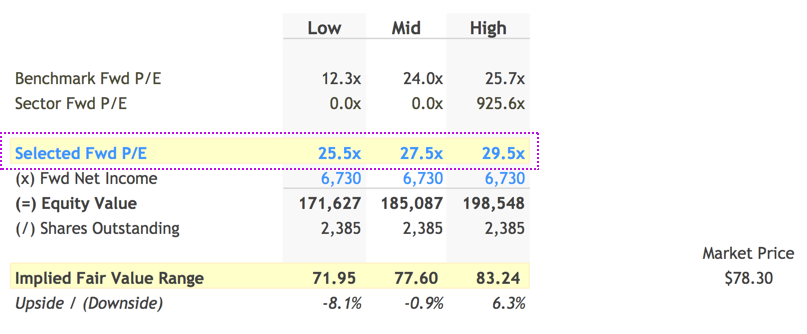
MasterCard is the best comparable for Visa and has similar projected growth and margin performance. I selected a Fwd P/E multiple range of 25.5x to 29.5x, in line with MasterCard and Global Payments on the low-end and above all it's peers on the high-end. My selection implied a Fair Value per Share range of $71.95 to $83.24, with a mid-point of $77.60.
Conclude on a Fair Value Range
Based on the range of fair values detemined using LTM and Forward Revenue, in this step you can input your concluded Fair Value Range and see how it compares to the current market price.
By default finbox.io uses a simple average of the two estimates. I felt equally confident in my LTM and Fwd Multiple selections so left the conclusion unchanged.
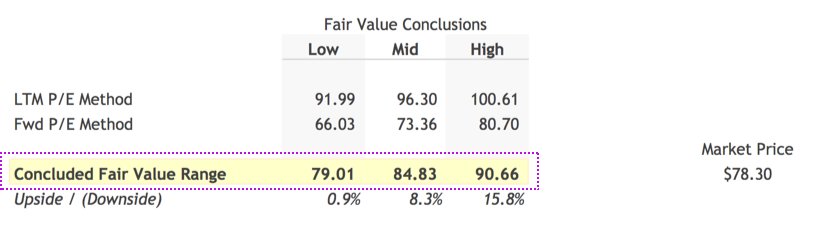
Based on my P/E multiples model, Visa currently appears to slightly undervalued by the market. I personally like investing when a company offers at least a 25% discount to my Fair Value estimate which in Visa's case would be ~$65/share. Visa's 52-Week Low is $60.00. If it were to get back to those level's again, I would love to take another look. Luckily, finbox.io's Price Target and Alerts features are great for tracking these types of movements!
Next Steps
Multiples Valuation models are useful in getting a sense of an industry quickly. Has the industry experienced a downturn recently? Is it on the upswing? How optimistic are analysts on the industry's prospects? What range of valuation multiples does the market assign to companies in this space?
You can answer many of these questions with a quick glance at the numbers. Then with a few assumptions, you can determine if a company justifies further research. Pretty awesome! Since no one valuation approach is perfect, we recommend using a combination of models to get a sense for the risks involved and triangulate a fair value before making an investment.

