
Why should I care about my stock's Current Ratio or Inventory Turnover? What about its Cash Conversion Cycle or Cash Ratio?
In the article below, I explain why using liquidity ratios can help find struggling businesses that may be inefficiently managed and ultimately help increase stock returns.
Consumer Stocks With Poor Liquidity Ratios
I always found it frustrating in school when finance professors would define financial terms rather than show why I should care about them.
So to start, I'll show why investors should be considering their stock's liquidity ratios in order to help improve returns. I created this Poor Liquidity Stock Screen to find companies in the consumer discretionary sector that have below average liquidity ratios. The screen found the following 20 companies as of December 8th, 2017:
| Ticker | Name | Current Ratio | Inventory Turnover | Cash Conversion Cycle | Cash Ratio |
|---|---|---|---|---|---|
| JRJR | JRjr33, Inc. | 0.4x | 6.5x | 43 days | 3.7% |
| AN | AutoNation, Inc. | 0.7x | 6.2x | 78 days | 0.9% |
| HOME | At Home Group | 0.8x | 3.5x | 112 days | 2.8% |
| HOV | Hovnanian Enterprises | 0.8x | 1.9x | 191 days | 19.6% |
| SHLD | Sears Holdings | 0.9x | 4.9x | 78 days | 8.9% |
| VLKAY | Volkswagen AG | 1.0x | 5.5x | 173 days | 22.8% |
| TUP | Tupperware Brands | 1.0x | 8.0x | 127 days | 18.7% |
| FENX | Fenix Parts, Inc. | 1.0x | 3.9x | 151 days | 2.6% |
| MNRO | Monro Muffler Brake | 1.0x | 7.5x | 38 days | 3.1% |
| BKS | Barnes & Noble, Inc. | 1.0x | 4.0x | 66 days | 1.1% |
| BAMXF | Bayerische Motoren Werke | 1.0x | 7.1x | 147 days | 22.6% |
| PAG | Penske Automotive Group | 1.0x | 5.9x | 77 days | 0.8% |
| PII | Polaris Industries Inc. | 1.0x | 6.5x | 56 days | 11.1% |
| GPI | Group 1 Automotive, Inc. | 1.0x | 6.5x | 64 days | 3.1% |
| HEAR | Turtle Beach Corp | 1.1x | 3.3x | 106 days | 0.7% |
| SAH | Sonic Automotive, Inc. | 1.1x | 6.7x | 72 days | 0.8% |
| CHCI | Comstock Holding | 1.1x | 1.0x | 319 days | 8.0% |
| ZAGG | ZAGG Inc | 1.1x | 6.6x | 62 days | 6.9% |
| DXLG | Destination XL Group | 1.1x | 3.9x | 127 days | 5.5% |
| FORK | Fuling Global Inc. | 1.1x | 8.0x | 68 days | 17.5% |
Okay, so the stocks above all have poor liquidity ratios. Why do we care?
Liquidity ratios measure the ability of a company to meet its short-term debt obligations implying that the companies listed above may be under financial duress. Therefore, you could reasonably expect that these businesses may be struggling which could lead to their stock prices underperforming.
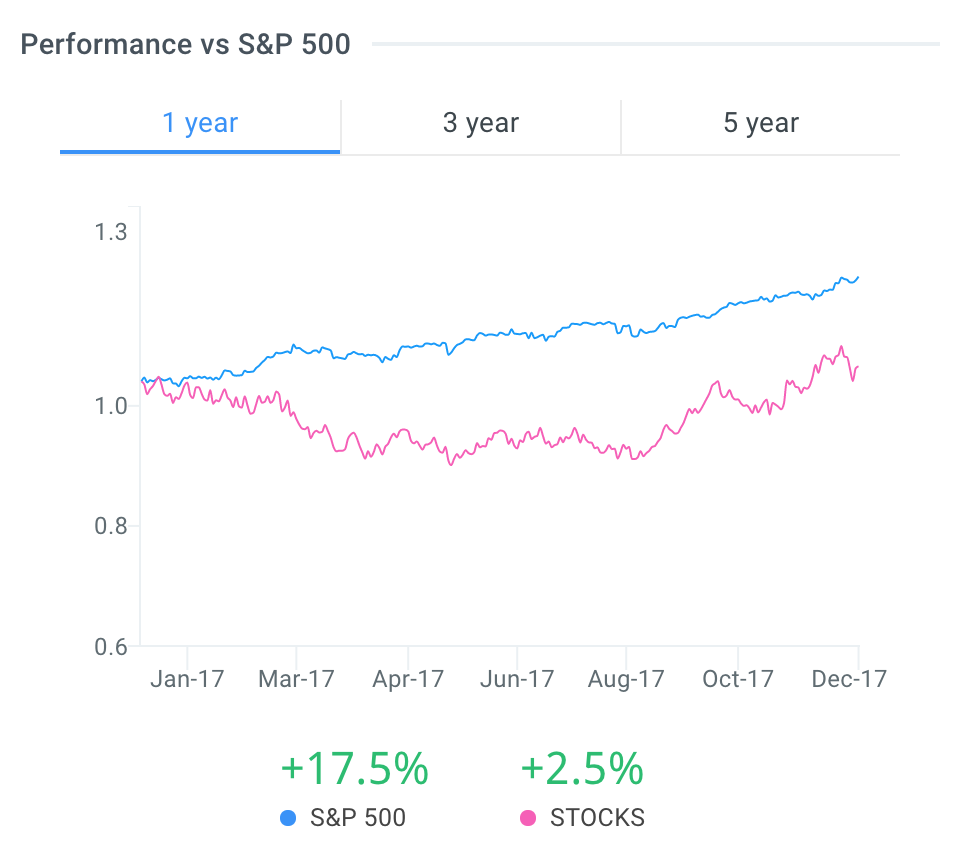
I exported the stock screen to google sheets and used finbox.io's spreadsheet add-on to calculate each stock's 1-year return as of December 8th. I found that seventy-five percent (75%) of the stocks above underperformed the S&P 500 over the last year. Furthermore, six of the twenty stocks (30%) lost more than 45% of their value over the last year.
The performance of an equally weighted index of these 20 stocks compared the S&P 500 over the last year is shown below.
It's also important to note that at this time last year, all of the companies above would have made this poor liquidity list except for Polaris Industries and Fuling Global. Polaris Industries and Fuling Global were two of the outliers as their share prices actually increased by 55.4% and 44.0% over the last 52-weeks, respectively.
In conclusion, these financial ratios could have been used to signal the troubling road ahead for many of these stocks. However, these liquidity ratios should not be used in isolation when making an investment decision. It is simply one piece of the puzzle that helps explain each company's unique narrative.
Understanding The Poor Liquidity Stock Screen
I used the following filters in the stock screen:
- Current Ratio < 1.15x
- Inventory Turnover < 8.5x
- Cash Conversion Cycle > 37 days
- Cash Ratio < 0.4x
- Sector = Consumer Discretionary
The latest results can be found here.
The thresholds chosen represent the averages of the consumer discretionary sector as calculated by finbox.io.
Current Ratio
The Current Ratio measures whether a firm is capitalized with enough assets to pay its debts over the next twelve months by comparing a firm's current assets to its current liabilities.
It's also often referred to as the quick ratio and can be defined as:
Current Ratio = Current Assets / Current Liabilities
Current assets often include:
- cash and cash equivalents
- short-term investments
- account receivables
- inventory
- prepaid expenses
And current liabilities often include:
- accounts payable
- short-term debt
- current interest payments for long-term debt
- salaries
- taxes
While ratios vary by industry and circumstances, healthy companies generally have ratios above 1.5x. However, a high current ratio is not necessarily a good thing. The company may be inefficiently using its current assets or short-term financing facilities.
Many analysts prefer the Current Ratio as a proxy for liquidity because it is easy to calculate and for its simplicity. However, this liquidity metric does have its limitations. The Generally Accepted Accounting Principles (GAAP) allows for several different types of ledgers to be classified under current assets and current liabilities so the ratio acts a catch-all in that it includes all current assets and all current liabilities. Therefore, it is not uncommon to see large swings in a company's current ratio from quarter to quarter.
This is another reason why investors should employ additional liquidity-related ratios to help compliment the current ratio when analyzing a stock such as Inventory Turnover.
Inventory Turnover
The Inventory Turnover ratio illustrates how many times a company's inventory is sold and replaced over the year. It's best to compare a company's Inventory Turnover relative to its peers or an industry average. A low turnover ratio may illustrate poor sales (excess inventory) while a high ratio may imply strong sales.
It is defined as:
Inventory Turnover = Revenue / Average Inventory
The Inventory Turnover ratio is also frequently referred to as the Inventory Utilization ratio and can help signal inefficient use of a company's cash. Inventory costs money, so a company doesn't earn a profit or return until that inventory is sold. Therefore, a low turnover ratio indicates a less effective cash management and increases the chances of inventory becoming obsolete.
Another helpful liquidity metric related to inventory efficiency is the Cash Conversion Cycle.
Cash Conversion Cycle
Cash Conversion Cycle, also referred to as the earnings cycle, is a metric that compares the number of days it takes a company to sell inventory and collect receivables relative to the number of days afforded to pay bills. It attempts to measure the time between the outflow and inflow of cash in the sales cycle.
For example, many companies buy inventory on credit as well as sell products on credit. These actions would increase the company's Accounts Payable liability and Accounts Receivable asset, respectively. However, cash has not yet been involved in these transactions until the company actually pays its Accounts Payables or collects its Accounts Receivables. The Cash Conversion Cycle attempts to measure the time between these cash outflows and inflows.
It is defined as:
Cash Conversion Cycle =
(+) Days Inventory Outstanding
(+) Days Sales Outstanding
(-) Days Payables Outstanding
A negative number of days suggests a company is able to receive payments for product sales before having to pay suppliers. This is good for Net Working Capital and free cash flow. However, a positive number of days suggests that a company pays its suppliers before receiving payments from product sales.
Again, it's best to compare a company's cash conversion cycle relative to its peers or an industry average. According to finbox.io, the average earnings cycle in the consumer discretionary sector is 37 days. A figure above 37 days could signal that a company is managing its earnings cycle less efficiently than its peers and could cause a cash squeeze in an economic downturn. A high cash ratio could help in this type of situation.
Cash Ratio
Some businesses may have trouble converting their accounts receivables and other assets into cash quickly, so another helpful measure of liquidity is the Cash Ratio. It is calculated as follows:
Cash Ratio = Cash and Cash Equivalents / Current Liabilities
This metric is a measure of the ability of a business to meet its current liabilities in business downturns. The average cash ratio of the consumer discretionary sector is 0.4x. A figure below 0.4x could signal that a company may not have enough cash reserves on hand in the event of a business downturn.
Should I Care About My Stock's Liquidity Ratios?
Absolutely, but not on an absolute basis. It's really just one part of the story. Investors should not buy or sell a stock based solely on its current ratio, inventory turnover, cash conversion cycle or cash ratio. These are simply insightful metrics that can be very helpful in understanding a company's narrative.
Liquidity ratios offer investors a quick glimpse into the health of a company as well as the efficiency in which it operates. Warren Buffett is considered by many to be one of the most successful investors in the world and is known for only investing in strong management teams. Analyzing a company's liquidity ratios relative to its peers is one potential way to weed out poorly run companies.

This is not a buy or sell recommendation on any security mentioned.
image source: onlinenewsconnect
Author: Matt Hogan
Expertise: Valuation, financial statement analysis
Matt Hogan is a co-founder of finbox.io. His expertise is in investment decision making. Prior to finbox.io, Matt worked for an investment banking group providing fairness opinions in connection to stock acquisitions. He spent much of his time building valuation models to help clients determine an asset’s fair value. He believes that these same valuation models should be used by all investors before buying or selling a stock.
His work is frequently published at InvestorPlace, Benzinga, ValueWalk, AAII, Barron's, Seeking Alpha and investing.com.
Matt can be reached at [email protected].


