
Kroger Earnings Preview
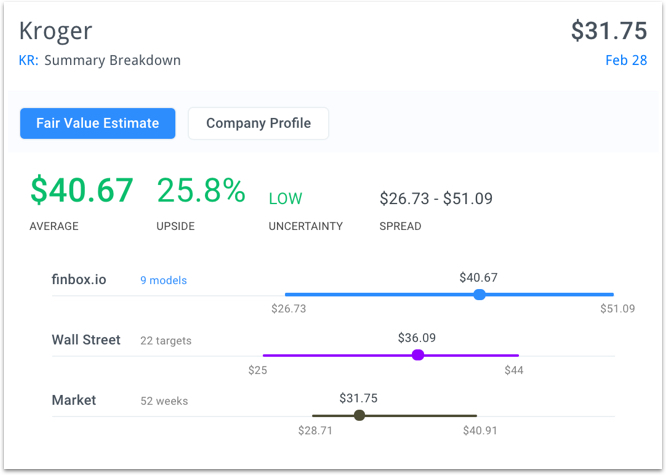
Kroger (NYSE:KR) is expected to report earnings on Thursday before the market opens. The company's shares last traded at $31.75 as of Tuesday afternoon, only 10% above its 52 week low. Finbox.io fair value data implies that Kroger's stock is currently 25% undervalued while Wall Street's consensus price target of $36.09 implies nearly 15% upside.
<img src='http://res.cloudinary.com/finbox/image/upload/v1488322060/KR_Fair_Value_iljc9u.jpg' alt= ‘KR finbox.io fair value estimate’>
Shares have been under pressure since Wolfe Research warned that price cuts enacted by Wal-Mart (NYSE:WMT) could impact sales.
What's more, shares of Target (NYSE:TGT) fell by over 10% after the company announced disappointing earnings Tuesday morning. Target's CEO Brian Cornell said on the earnings call that the retail industry is seeing a seismic shift in buying trends as consumer's turn to digital resources and focus on pricing.
While brick-and-mortar industry headwinds are real, the recent pullback could also provide opportunities. As Warren Buffett recommends, "be greedy when others are fearful."
Kroger's PE Multiples Show Value
Kroger's stock looks attractive when comparing the company's financial performance to publicly traded peers: CVS Health (NYSE:CVS), Sprouts Farmers Market (NasdaqGS:SFM), Wal-Mart and Whole Foods Market (NasdaqGS:WFM).
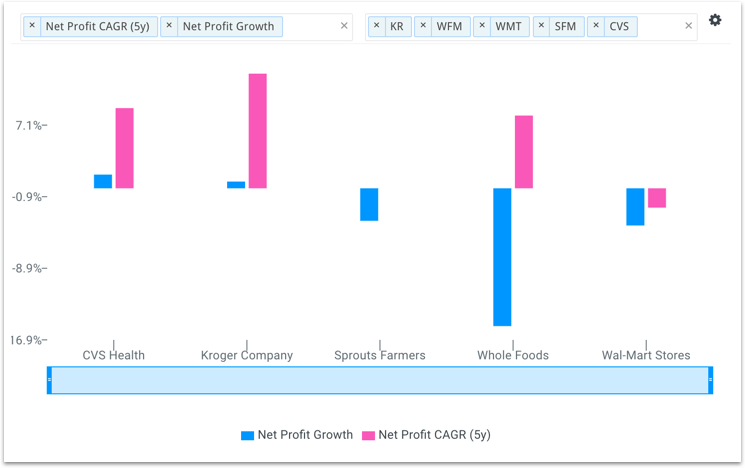
The retail giant's net income growth over the last twelve months of 0.8% is nothing spectacular. However, it is above SFM (-3.6%), WMT (-4.1%), WFM (-15.4%) and only slightly below CVS (1.5%). In addition, Kroger's compounded annual growth rate (CAGR) over the last five years of 12.8% is well above the entire comparable company group as shown below.
<img src='http://res.cloudinary.com/finbox/image/upload/v1488322075/KR_NI_Growth_Chart_vczjt8.jpg' alt= ‘KR net income growth chart‘>
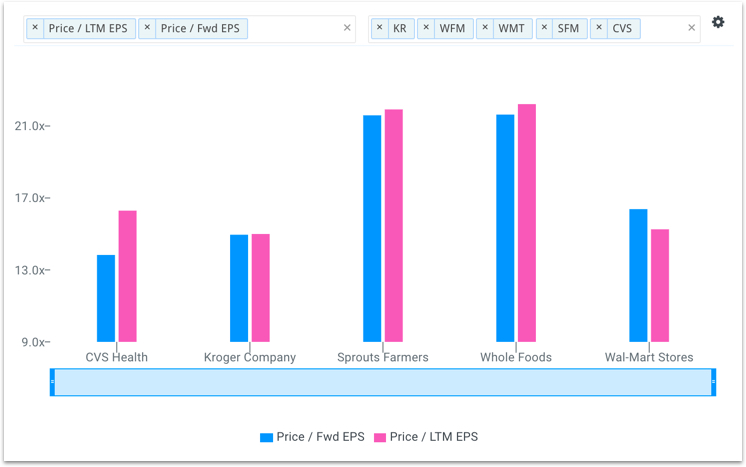
Typically, higher growth stocks will trade at higher price-to-earnings multiples but this does not appear to be the case for Kroger. The company's PE multiple of 15.5x is only slightly above WMT (15.2x) and below CVS (16.9x), SFM (20.3x) and WFM (19.8x).
<img src='http://res.cloudinary.com/finbox/image/upload/v1488322075/KR_PE_mults_fgp8ru.jpg' alt= ‘KR PE multiples chart‘>
Furthermore, Kroger's multiples have historically traded at approximately 18.0x on a rolling 1-year and 5-year average. Given the data points listed above, one could argue that the company should be trading at a higher multiple.
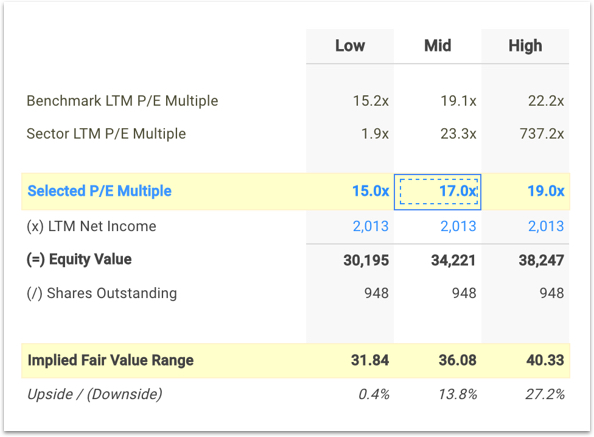
When selecting 17.0x in finbox.io's PE multiples valuation, Kroger's implied fair value is approximately $36 per share as illustrated below. This implies 14% upside and is right in line with Wall Street's consensus price target.
<img src='http://res.cloudinary.com/finbox/image/upload/v1488322075/KR_PE_Selection_x2eb2b.jpg' alt= ‘KR PE multiple valuation‘>
View full model
Final Notes
Kroger appears fundamentally undervalued relative to comparable companies in addition to its own historical valuation multiples. Value investors may want to take a closer look at the stock prior to earnings. Especially if the company follows recent retail trends and reports disappointing figures.
Get Started Now!
photo credit: wikipedia
Note this is not a buy or sell recommendation on KR. It is purely an overview of the stock's underlying fundamentals so that investors can come to an informed decision.

