
SS&C Technologies Holdings, Inc (NASDAQ: SSNC) trades at a P/E multiple of 39.4x, which is higher than the Information Technology sector median of 30.0x. While this makes SSNC appear like a stock to avoid or sell if you own it, you might change your mind after gaining a better understanding of the assumptions behind the P/E ratio. In this article, I will break down what the P/E ratio is, how to interpret it and what to watch out for.
Understanding Valuation Multiples and the P/E Ratio
A multiples valuation, also known as a comparable companies analysis, determines the value of a subject company by benchmarking the subject's financial performance against similar public companies (peer group). We can infer if a company is undervalued or overvalued relative to its peers by comparing metrics like growth, profit margin, and valuation multiples.
A P/E Multiple is a valuation ratio that indicates the multiple of earnings investors are willing to pay for one share of a company:
P/E Multiple = Stock Price ÷ Earnings Per Share
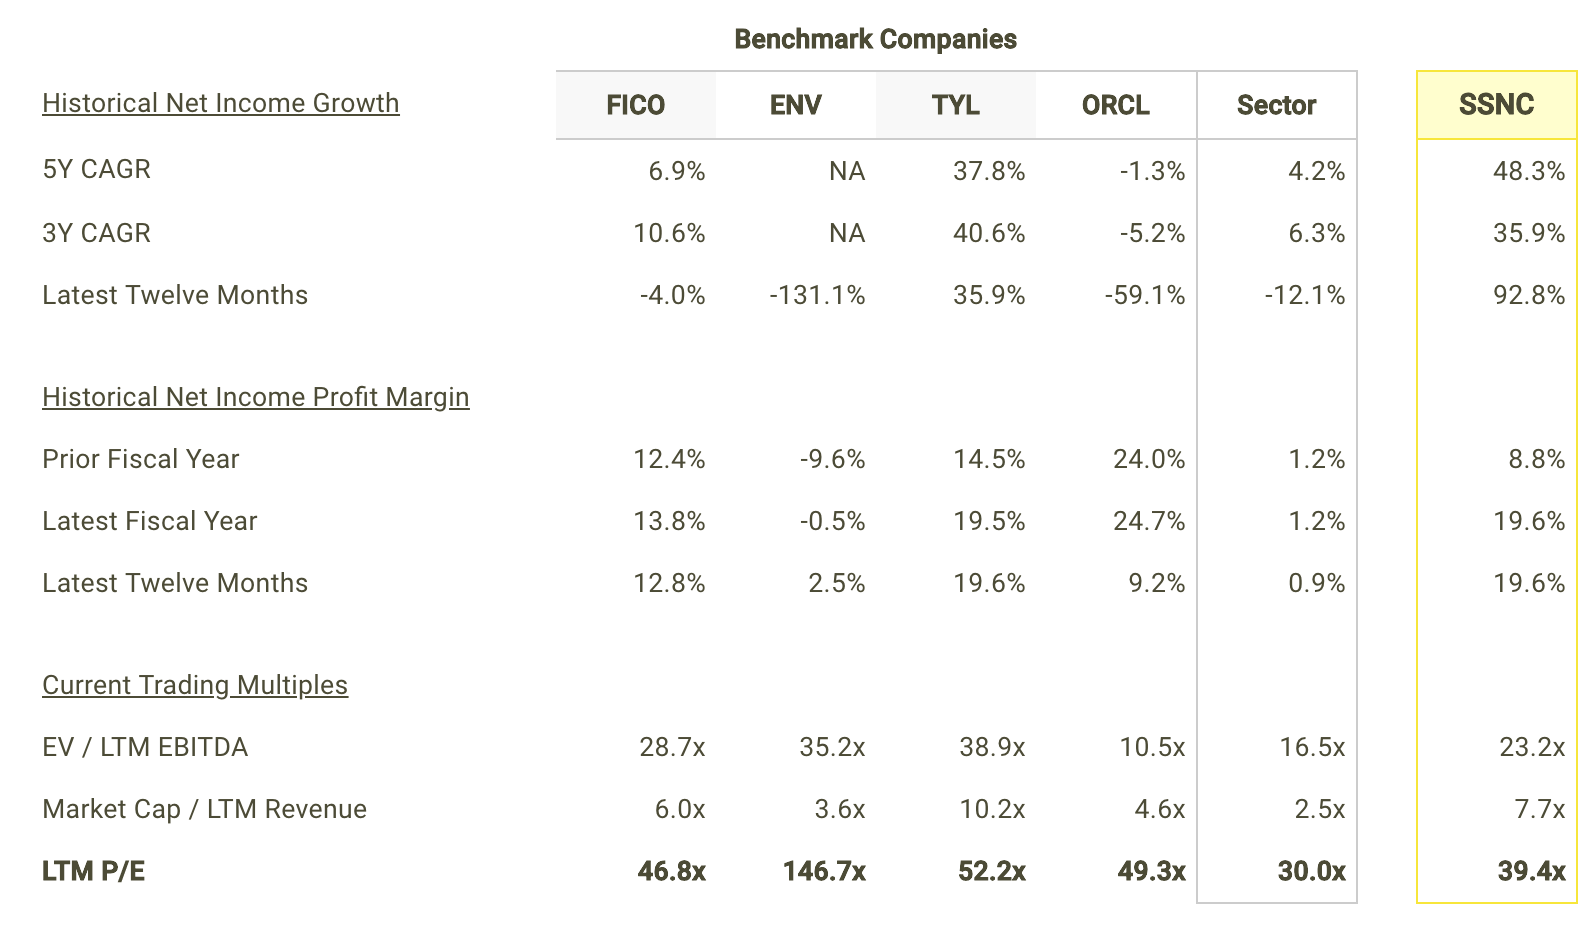
The P/E ratio is not meant to be viewed in isolation and is only useful when comparing it to other similar companies. Since it is expected that similar companies have similar P/E ratios, we can come to some conclusions about the stock if the ratios are different. I compare SS&C's P/E multiple to those of Fair Isaac Corporation (NYSE: FICO), Envestnet Inc (NYSE: ENV), Tyler Technologies, Inc (NYSE: TYL) and Oracle Corporation (NYSE: ORCL) in the chart below.
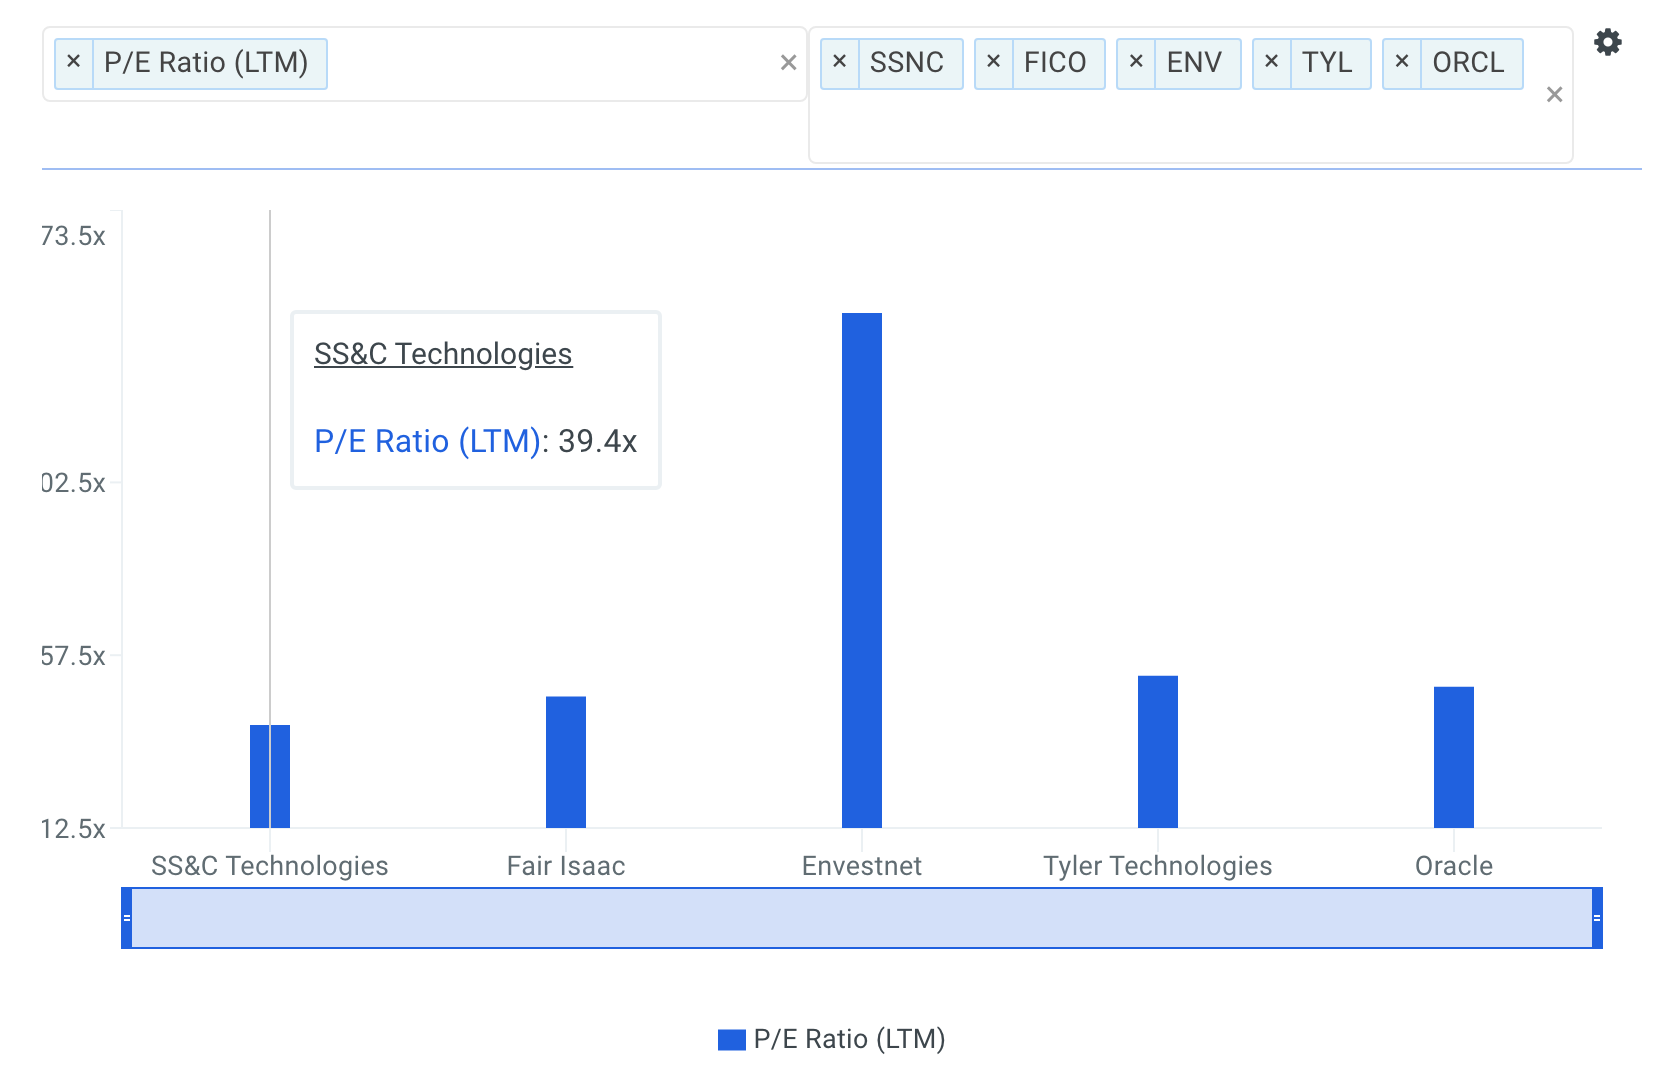
source: finbox.io Benchmarks: P/E Multiples
Since SS&C's P/E of 39.4x is lower than the median of its peers (50.7x), it means that investors are paying less than they should for each dollar of SSNC's earnings. As such, our analysis shows that SSNC represents an undervalued stock. In fact, finbox.io's P/E Multiple Model calculates a fair value of roughly $67.50 per share which implies approximately 28.5% upside.
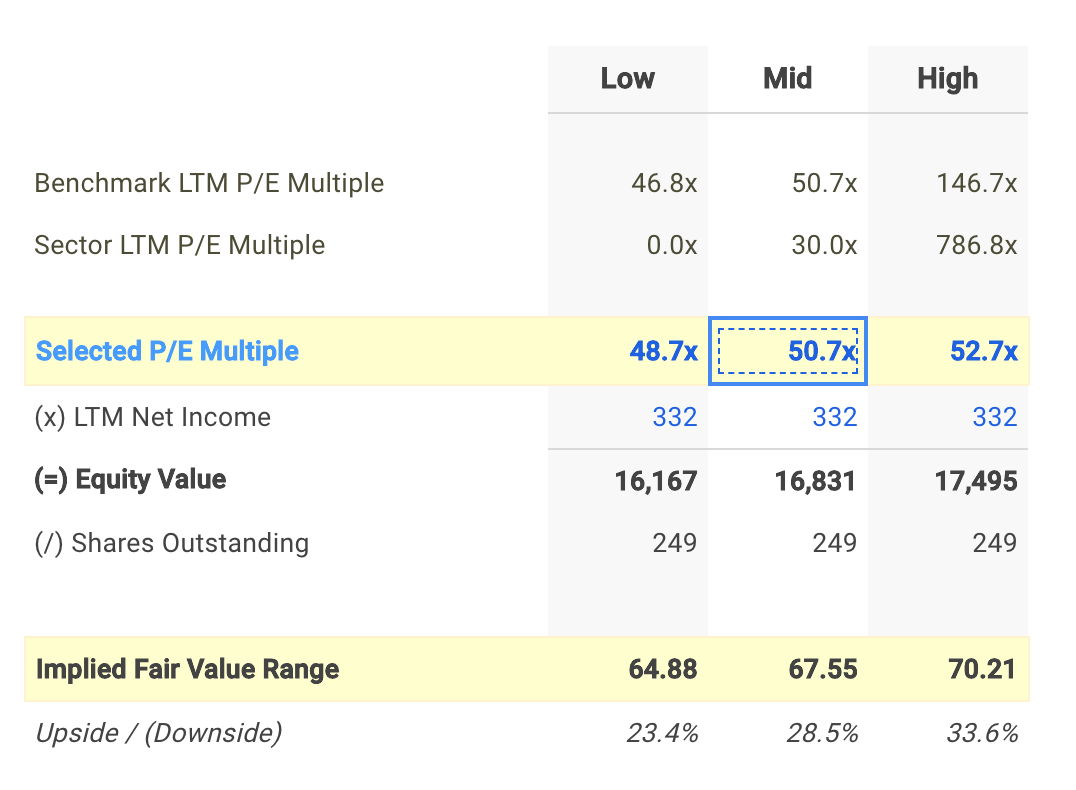
Note that the selected multiple of 50.7x in the analysis above was determined using SS&C's current P/E multiple with its peer group.
Understanding the P/E Ratio's Limitations
Before jumping to the conclusion that SS&C should be added to your portfolio, it is important to understand that our conclusion rests on two important assumptions.
(1) the selected peer group actually contains companies that truly are similar to SS&C, and
(2) the selected peer group stocks are being fairly valued by the market.
If the first assumption is not accurate, the difference in P/E ratios could be due to a variety of factors. For example, if you accidentally compare SS&C with higher growth companies, then its P/E multiple would naturally be lower than its peers since investors reward high growth stocks with a higher price.
source: P/E model
Now if the second assumption does not hold true, SS&C's lower multiple may be because firms in our peer group are being overvalued by the market.
What This Means For Investors
As a shareholder, you may have already conducted fundamental analysis on the stock so its current undervaluation could signal a potential buying opportunity to increase your position in SSNC. However, keep in mind the limitations of the P/E ratio when making investment decisions. There are a variety of other fundamental factors that I have not taken into consideration in this article. If you have not done so already, I highly recommend that you complete your research on SS&C by taking a look at the following:
Valuation Metrics: how much upside do shares of SS&C have based on Wall Street's consensus price target? Take a look at our analyst upside data explorer that compares the company's upside relative to its peers.
Risk Metrics: how is SS&C's financial health? Find out by viewing our financial leverage data metric which plots the dollars in total assets for each dollar of common equity over time.
Efficiency Metrics: is management becoming more or less efficient over time? Find out by analyzing the company's asset turnover ratio which measures the dollars in revenue a company generates per dollar of assets.
As of this writing, I did not hold a position in any of the aforementioned securities and this is not a buy or sell recommendation on any security mentioned.
Author: Matt Hogan
Expertise: Valuation, financial statement analysis
Matt Hogan is a co-founder of finbox.io. His expertise is in investment decision making. Prior to finbox.io, Matt worked for an investment banking group providing fairness opinions in connection to stock acquisitions. He spent much of his time building valuation models to help clients determine an asset’s fair value. He believes that these same valuation models should be used by all investors before buying or selling a stock.
His work is frequently published at InvestorPlace, Benzinga, ValueWalk, AAII, Barron's, Seeking Alpha and investing.com.
Matt can be reached at [email protected].


