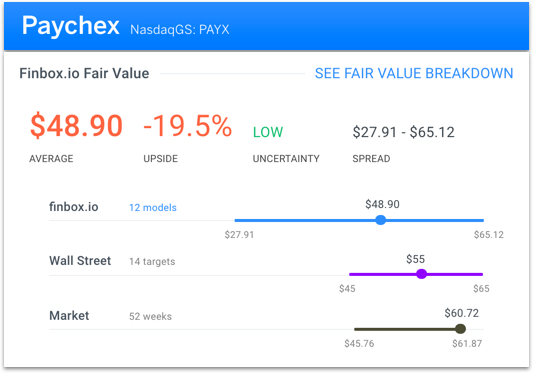
Paychex, Inc. (NasdaqGS:PAYX) is expected to report earnings next Wednesday the 21st before the market opens. The company's shares last traded at $60.72 as of Monday (15th), approximately 98% of its 52 week high and 106% of its 50 day moving average. Finbox.io fair value data implies that the stock is approximately 20% overvalued while Wall Street's consensus price target of $55.00 implies 9% downside.
<img src='http://res.cloudinary.com/finbox/image/upload/v1481834874/PAYX_Fair_Value_x2f0zs.jpg' alt= ‘PAYX finbox.io fair value estimate’>
Comparable Company Analysis
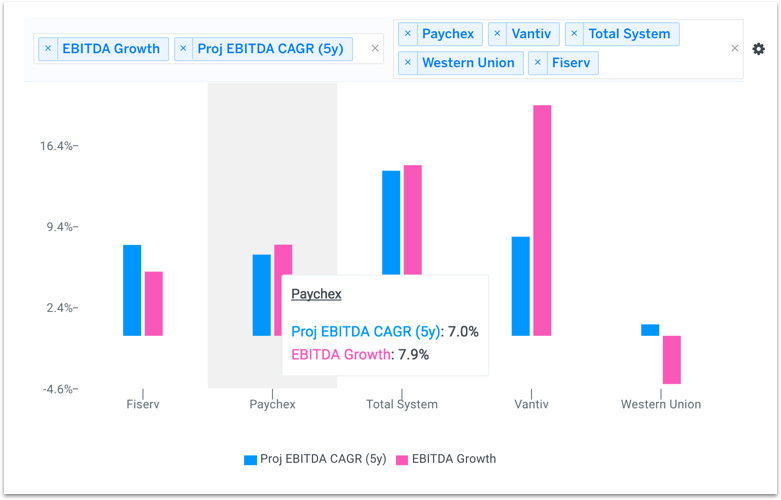
Paychex looks unattractive when comparing EBITDA growth to its publicly traded peer group: Fiserv, Inc. (NasdaqGS:FISV), Total System Services, Inc. (NYSE:TSS), Vantiv, Inc. (NYSE:VNTV) and The Western Union Company (NYSE:WU).
The company's LTM EBITDA growth of 7.9% is above FISV (5.5%) and WU (-4.2%) but below TSS (14.7%) and VNTV (19.9%). When comparing Wall Street's consensus forecast for each company, Paychex projected 5yr EBITDA CAGR of 7.0% is only above WU (1.0%) and below FISV (7.8%), TSS (14.3%) and VNTV (8.6%).
<img src='http://res.cloudinary.com/finbox/image/upload/v1481834874/PAYX_EBITDA_Growth_wifkzn.jpg' alt= ‘PAYX EBITDA growth chart‘>
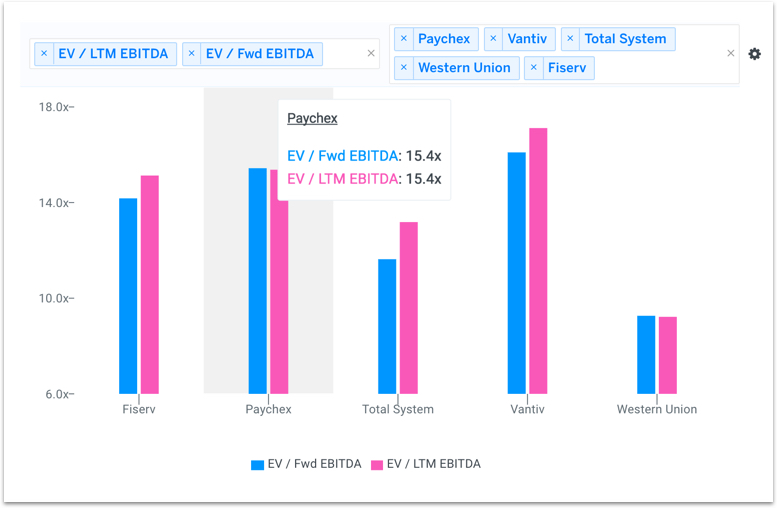
These growth figures don't help explain why the company's EBITDA multiples trade at a premium to this comparable company group. Typically, higher growth stocks will trade at higher multiples of EBITDA but this isn't the case for Paychex. The company's forward EBITDA multiple of 15.4x is above FISV (14.2x), TSS (11.6x) and WU (9.2x) and only slightly below VNTV (16.2x).
<img src='http://res.cloudinary.com/finbox/image/upload/v1481834872/PAYX_EBITDA_Multiples_kpawk6.jpg' alt= ‘PAYX EBITDA multiples chart‘>
Final Notes
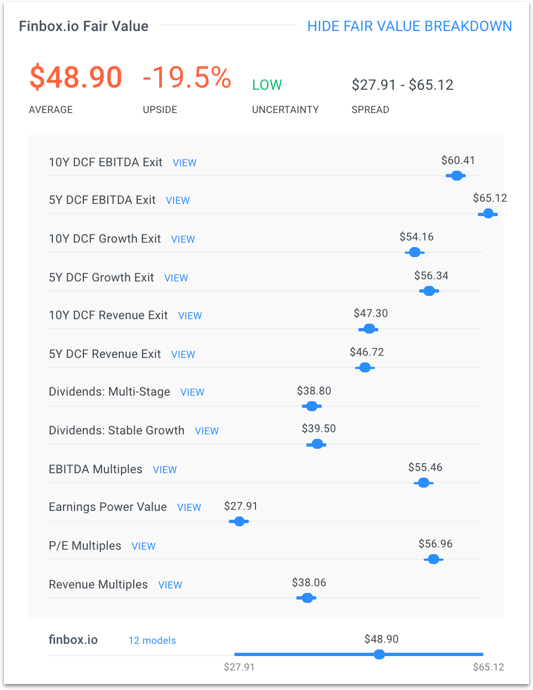
Paychex appears fundamentally overvalued when inputting Wall Street projections into various discounted cash flow (DCF) analyses and dividend discount models (DDM) as illustrated in the football field chart below. The majority of the analyses imply an intrinsic value range between $45 to $55 per share while the average of all 12 models conclude a fair value of approximately $49 per share.
<img src='http://res.cloudinary.com/finbox/image/upload/v1481834874/PAYX_Fair_Value_Detail_wcrefq.jpg' alt= ‘PAYX Finbox.io Fair Value Detail‘>
Value investors who are long the stock may want to take a closer look prior to earnings.
Get Started Now!
Note this is not a buy or sell recommendation on Paychex. It is purely an overview of the stock's underlying fundamentals so that investors can come to an informed decision.

