
In the summer of 1955, America was captivated by a new television quiz show called “The $64,000 Question.” 85% of all viewing audiences tuned in creating a mainstream fascination. The popularity of the show was so great that it created a market for gamblers, betting specifically on who would win that night's contest. To satisfy market needs, the show aired at different times on both the East and West coast. Before long, a few gamblers wised up and started phoning the East coast results to West Coast bookmakers, profiting from an opportunity window to front-run the show's results.
Like most things, the show eventually lost its allure and America found something else to satisfy their nightly viewing. As the show came to an end so too did the opportunity for Gamblers to make a quick and easy buck front-running bets. What provided a few hours of entertainment and a few dollars for gamblers also led to a tool that would be used by many legendary investors of the future.
It was during that time a young scientist by the name of John Kelly heard about the gamblers scheme. Kelly was a smart young scientist working for AT&T Bell Labs alongside his mentor Claude Shannon. Hearing how the gamblers profited, Kelly was curious not as much in the mechanics of the scheme, but more around how the gamblers could optimize their bankroll to maximize overall returns related to the opportunity.
Kelly used the mathematics behind Claude Shannon’s information theory to put together what is referred to today as the Kelly Criterion method. The basics of his findings were that a gambler could use his inside edge over given odds in an optimized format that would allow him to minimize risk and maximize opportunity in the long run. It simply answered the question, "given the opportunity and my bankroll, how much should I bet?”
When Kelly went to publish his findings, there were two things AT&T didn’t like. The first was that Kelly intended to publish his findings in an article titled “Information Theory & Gambling,” a title that didn’t sit well with AT&T executives. The second, was how much Kelly mentioned the use of a “Private Wire” in the article, which undoubtedly might not sit well with AT&T customers. Eventually, the article got published in the 1956 issue of Bell System Technical Journal under the title “A New Interpretation of Information Rate.”
The Kelly Criterion system has shown up as a strategic tactic deployed by some of the most legendary investors. Warren Buffett is said to have used it early and often in his career and even today when he trades in his personal account. Mohnish Pabrai went as far as to detail it in his book The Dhando Investor. Bill Miller who beat the market 15 straight years at Legg Mason has long been an advocate. Ed Thorp who has achieved a 20% annualized return for 30 years, took it to Casinos before unleashing it on Wall Street. It’s not a perfect model but as the saying goes, “Success leaves clues.”
How it works

Visualizing a scenario detailed by Mohnish, let’s walk through how to use the Kelly Criterion method to arrive at an optimal capital allocation position for a given opportunity.
In this example, you are offered the opportunity to flip a coin, heads you win $2, tails you lose $1. The hypothetical opportunity can be visualized below:
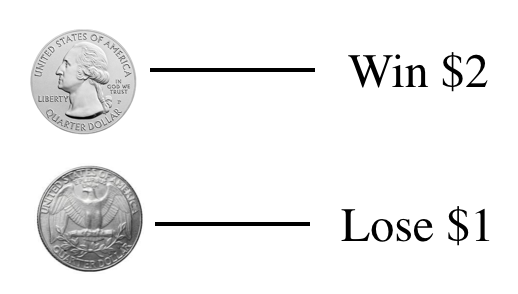
The first step towards figuring our optimal capital allocation for this opportunity is figuring out the scenario results. For this opportunity the scenario results are either we will Win $2 or Lose $1.

The next step is identifying the probability of each scenario. We will assume this is a fair coin with equal chances of landing on heads or tails. This gives us a 50 / 50 probability of either scenario occurring.

Now that we have our scenario and probability we can figure out our Total Expected Outcome. We can arrive at our total expected outcome, by multiplying each scenario with its respected probability and adding the two sums together. For this opportunity, we arrive at a total expected outcome value of $0.50. Arriving at our total expected outcome gives us our Edge value.

From there, Kelly tells us, we plug in our Edge value (our Total Expected Outcome) over the odds we were given for the winning scenario.
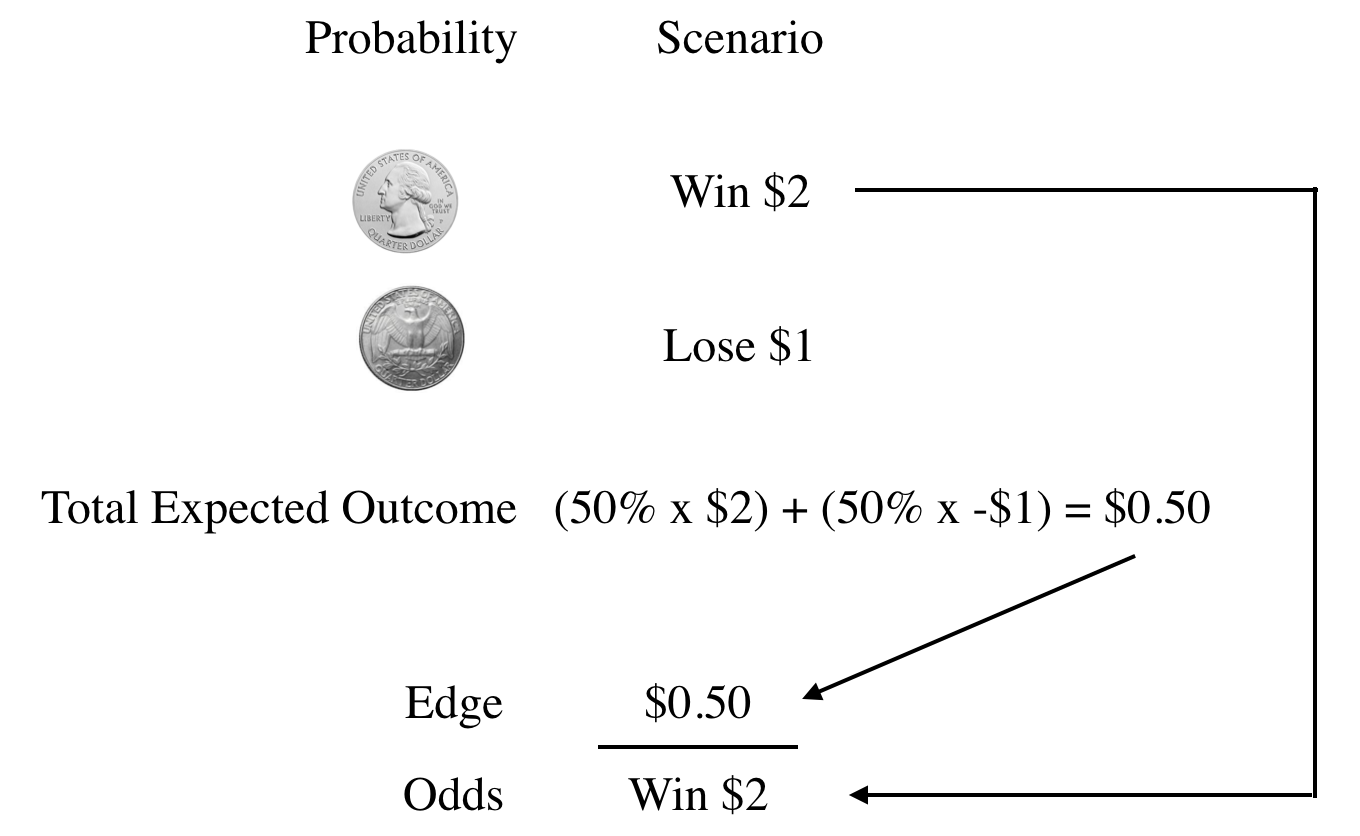
Doing this we can arrive at the final conclusion of the Kelly Criterion formula, which tells us if we were offered this opportunity we should invest 25% of our bankroll.

Apply to Investing
Now that we understand the basic mechanics of the Kelly Criterion formula let’s apply it to an investing opportunity that isn’t predicated on the results of a coin flip.
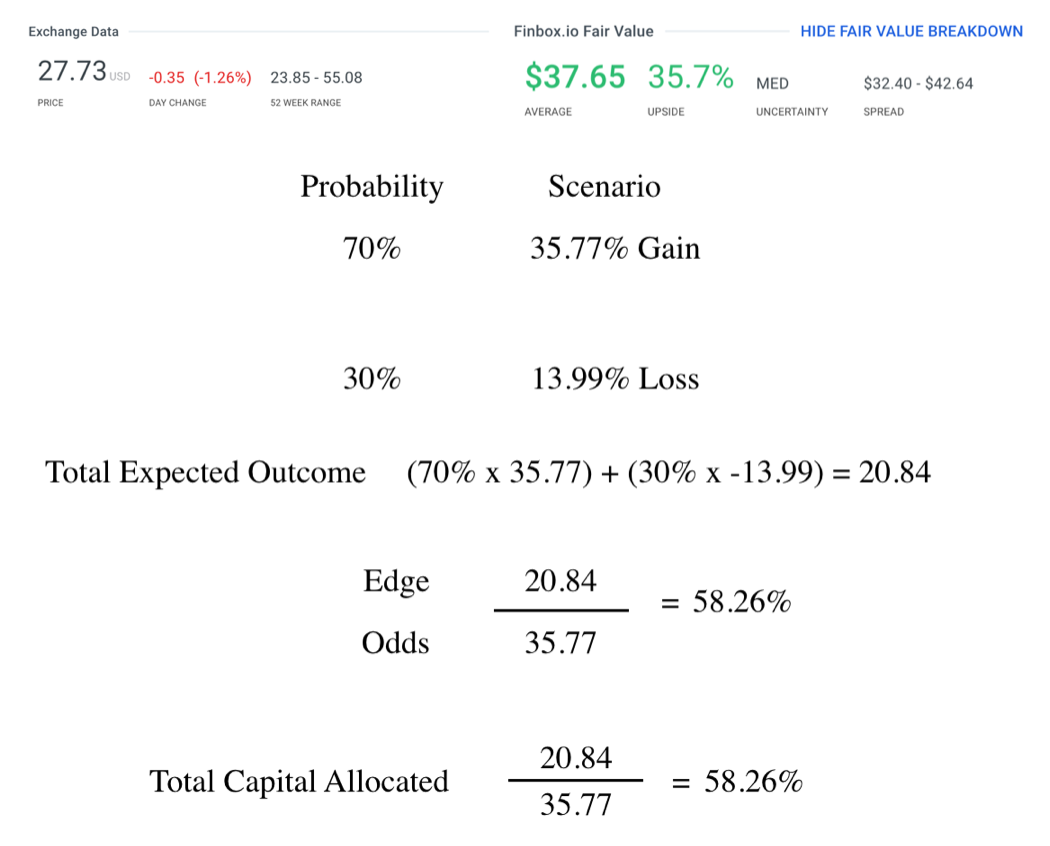
A company that has been generating headlines and activist attention is currently trading at $27.73 per share with a nice upside range showing on a few fair value models.


After a bit of research and analysis, let’s say I conclude that the company is worth $37.65 on the upside with the downside coming in at around $23.85.

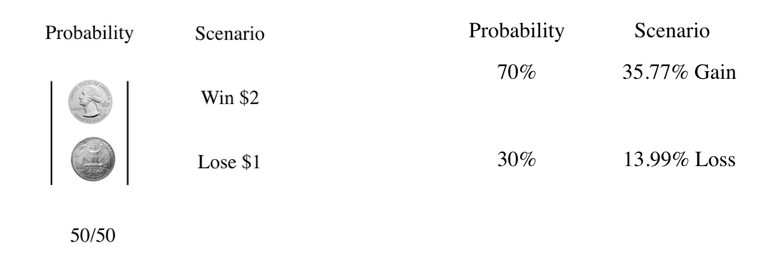
Using a price range from various models and my own methods of analysis I conclude that there is a 70% probability the share price will reach the $37.65 mark and a 30% probability the share price will dip to $23.85.

Next, I need to figure out the actual gains and losses of the share price movement.

Now, just like in our coin flip example I have defined my probabilities and scenarios.
Knowing the probabilities and scenarios allow me to calculate the Total Expected Outcome.

The Total Expected Outcome is used as my edge when using Kelly’s Formula.

The Kelly Criterion formula tells me I should allocate 58.26% of my capital to this opportunity.
If you are like most investors, betting 58.26% of your capital on a single position is difficult to stomach. A solution that will help provide a more holistic approach to managing an entire portfolio is incorporating a metric to account for a drawdown. Doing this would allow you to smooth out what would otherwise be violent swings in performance if you were to allocate the full amount the Kelly Criterion model suggests.
To do this, you will need to assign what you consider to be an acceptable drawdown that you or your investors are willing to tolerate. Let’s say you manage a portfolio of $200,000,000 and have decided that an acceptable drawdown at any given moment is 15%.

Taking your entire portfolio size, you can multiply your acceptable drawdown and then again multiple the results of the Kelly Criterion formula to give you an appropriate capital position to be allocated to the given opportunity. In this example, we arrive at an amount of $17,478,000 or roughly 8.74% of our overall portfolio. For some, 8.74% is still a highly concentrated position, but not nearly as concentrated as the 58.26% Kelly’s model gave us before.

Flaws of Kelly Criterion
Where to begin… There are many flaws surrounding the Kelly Criterion model which have inevitably led to low interest from academics in finance. Low interest from academics leads to even lower interest in adoption by professional capital allocators.
Only as good as the inputs
The first and perhaps most notable flaw is that the model is only as good as the inputs. Seeing as the results of the model is heavily dependent on the assessment of future outcomes, the model is relying on an unknown future event to materialize with precise accuracy. This can be said with most models but is especially true with the Kelly Criterion model. When applying inputs, you must make an accurate assessment of the future outcome and an individual assessment of the probability of that outcome. From the start, there are two layers that can go wrong.
Bias toward the modeler
Another evident flaw of the model is the bias disposition of the modeler. If you are using the Kelly Criterion model and lean towards the conservative side of estimations, you will under-allocate what would otherwise be highly profitable positions. On the other hand, an overly optimistic assumption will create over-allocation in less advantageous positions, thus leading to poor long-term performance. Either way, results will regress to the mean if too much bias from the modeler is deployed.
Built around single events in known time frames
The way John Kelly designed the Kelly Criterion model was specific for gambling events that had a known start and end time. The gambler could roll his earnings or loss into the next singular event. As an investor, we don’t always know how long it will take for an outcome of an investment thesis to materialize. This creates a problem in the fact that optimizing our bankroll is much more difficult than the gamblers Kelly was modeling. The other difficulty is in the binary nature of the model. Unlike betting on horses, very seldom do investments go completely to zero. The way the model is built presents an inaccurate assumption for when positions might be between modeled results.
Overall, the Kelly Criterion model has its evident flaws but is a useful tool that you can add to your toolbox. There is a reason notable investors have used it over the years and will continue to use it going forward.
Sources;
Kelly, J. L. (1956). A New Interpretation of Information Rate. The Bell System Technical Journal. Retrieved from http://homepages.wmich.edu/~ledyaev/kelly1956.pdf
Pabrai, M. (2007). The Dhandho investor: The low-risk value method to high returns. Hoboken, NJ: John Wiley & Sons.
Schwager, J. D. (2012). Hedge fund market wizards. Hoboken, NJ: Wiley.
Poundstone, W. (2005). Kelly. Retrieved from
http://homepages.wmich.edu/~ledyaev/kelly1956.pdf
Author: Carter Johnson
Expertise: Entrepreneurship and business strategy
Carter is the founder of United Business Leaders which invests in private companies with strong operating histories. He has a passion for investing and helping businesses with strategic initiatives.
Connect with Carter on LinkedIn.

image source: usnews

