
Herman Miller, Inc. (NasdaqGS: MLHR) shares last traded at $34.22 as of Friday, September 15, approximately 94.1% of its 52-week high. While the stock is nearly flat year-to-date, shares are up almost 15% since late June.
The company is expected to report earnings on Wednesday, September 20th after the market close. Herman Miller's results have been mixed of late as illustrated in the table below. The company has missed their revenue estimate for four straight quarters. However, management has improved operating margins which has helped produce positive EBITDA and Net Income surprises the prior two quarters.
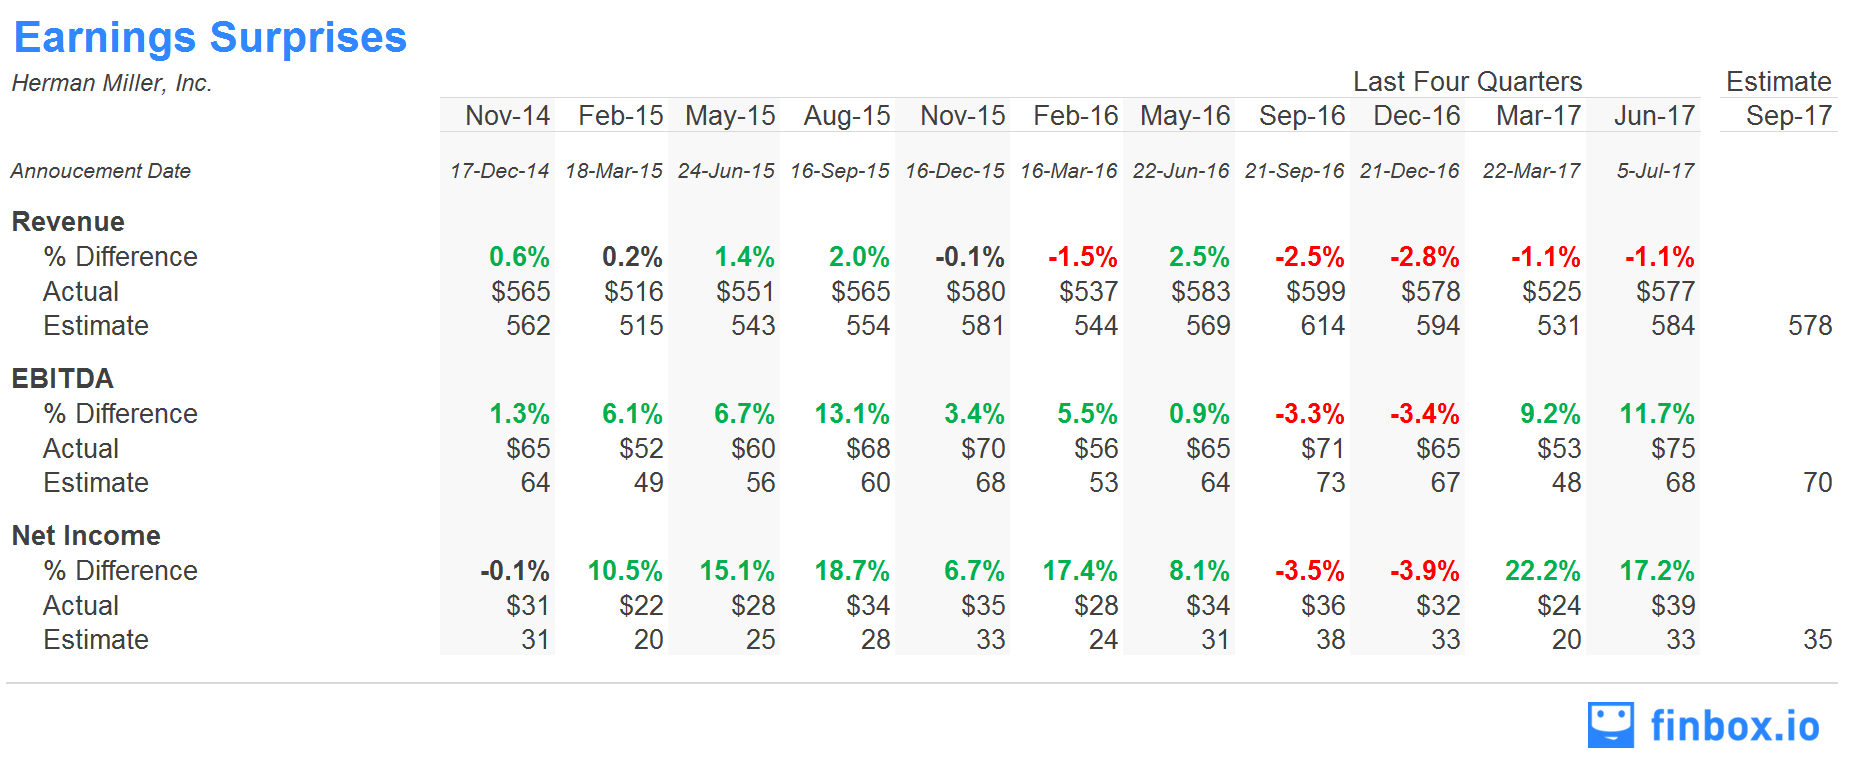
We highlight below what investors should know prior to the earnings report on Wednesday.
Business and Demand Indicators
Herman Miller is a leader in design, manufacture, selling, and distribution of office furniture systems, seating products, and other freestanding furniture elements, textiles, home furnishings, and related services.
The company separates its business into four segments: North America Furniture Solutions, ELA Furniture Solutions (including EMEA, Latin America, and Asia-Pacific), Specialty (high-craft furniture and textiles), and Consumer.
<img src='http://res.cloudinary.com/finbox/image/upload/v1498599506/MLHR_Segments_gp76he.jpg' alt= ‘MLHR Revenue Segments Chart’>
Source: Herman Miller 10-K, 2016
The North American operations hold the lion share of the company’s business. Typically, demand from this segment is directly correlated with the following three economic indicators: CEO confidence, overall business capital spending, and job growth.
What Bullish Investors Point To
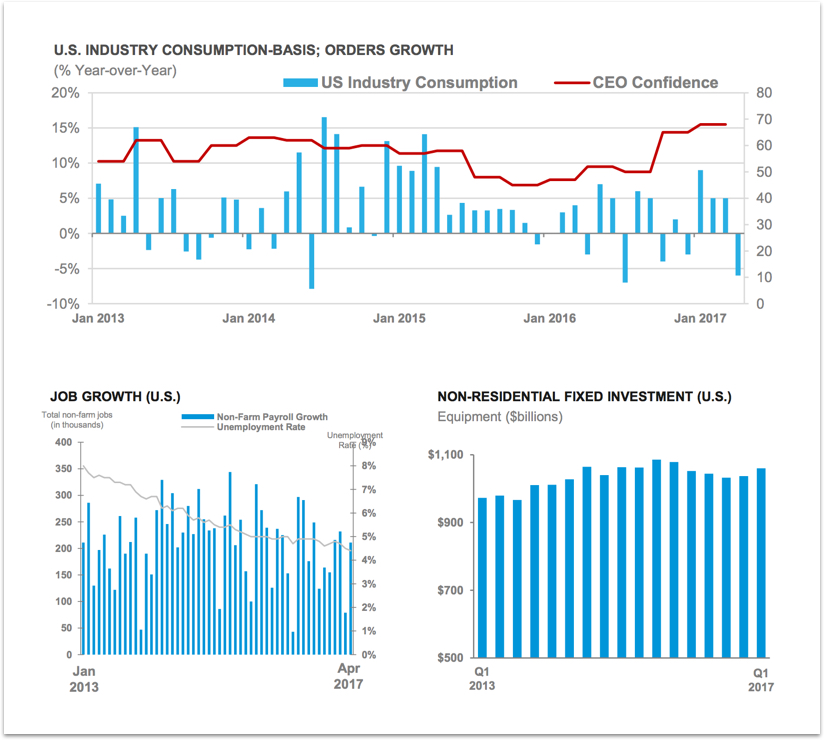
Investors long shares of Herman Miller highlight that the indicators driving demand for its products are all in a healthy territory as shwon below.
<img src='http://res.cloudinary.com/finbox/image/upload/v1498599507/Steelcase_IP_dmptn5.jpg' alt= ‘MLHR Demand Drivers Chart’>
Source: Investor Presentation, Steelcase
Analysts covering the stock often compare the company to a peer group that includes HNI Corp (NYSE: HNI), Steelcase (NYSE: SCS), Knoll, Inc. (NYSE: KNL) and Acco Brands (NYSE: ACCO). Comparing Herman Miller's returns to this peer group explains why investors prefer the stock.
Return on Invested Capital (ROIC) is used to evaluate the ability of a company to create value for all its stakeholders, debt and equity. Return on Equity (ROE) measures how effectively management makes investments to generate earnings for equity holders.
Herman Miller's ROIC of 15.2% is above all of its selected comparable public companies: HNI (7.4%), SCS (11.3%), KNL (13.5%) and ACCO (6.1%). The company's ROE of 22.3% is above also above HNI (12.7%), SCS (16.2%) and ACCO (7.9%) while only slightly below KNL (23.5%).

source: finbox.io
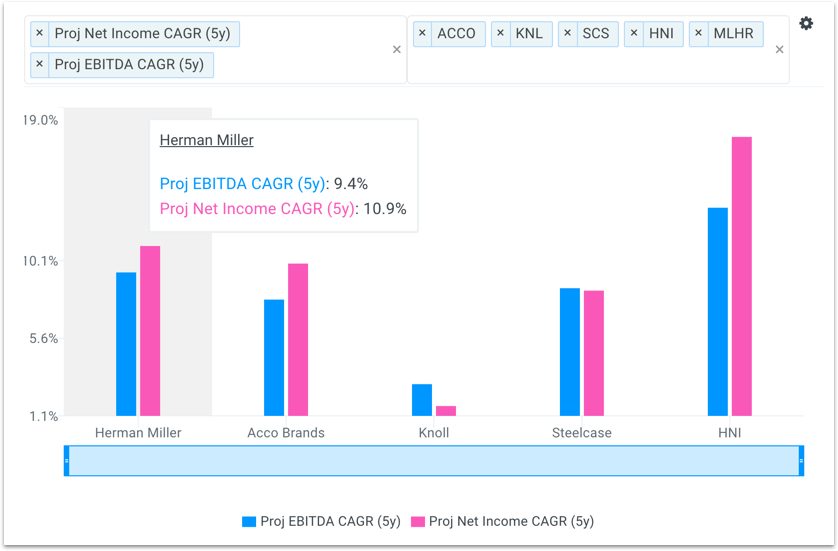
In addition, analysts also expect the company's EBITDA and profits to grow at a faster rate than the majority of its peers.
source: finbox.io
Herman Miller's projected 5-year EBITDA CAGR of 9.4% is above selected comparable public companies: SCS (8.5%), KNL (2.9%) and ACCO (7.8%) and only below HNI (13.1%). Similarly, the company's projected 5-year net income CAGR of 10.9% is above SCS (8.3%), KNL (1.6%) and ACCO (9.9%) and, again, only below HNI (17.2%).
What Bearish Investors Point To
While Herman Miller's returns and projected growth impress investors, the company does face significant headwinds such as commodity cost pressures, political uncertainty, and a potential product shift. Furthermore, investors bearish shares also point to the stocks high valuation multiples arguing that future growth is already priced in.
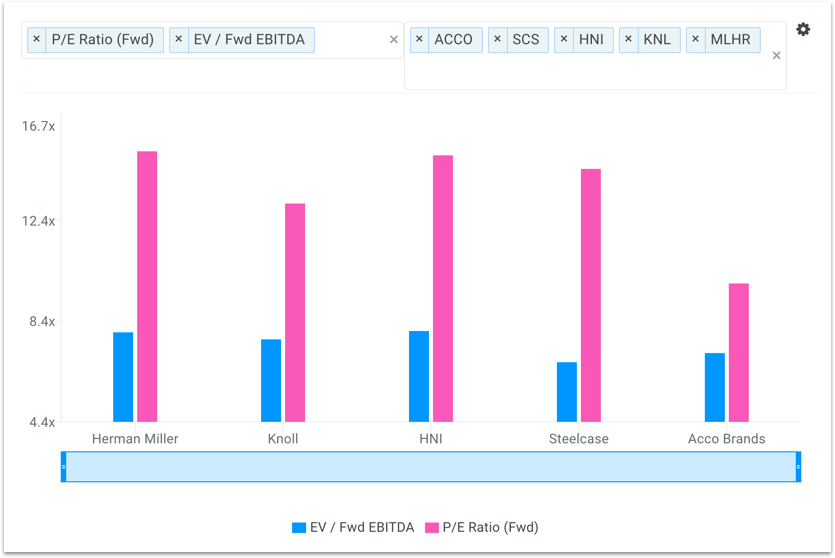
A company's EBITDA multiple is calculated by dividing its Enterprise Value by EBITDA and is often used to benchmark the fair market value of a company. Its key benefit over the P/E multiple is that it's capital structure-neutral, and, therefore, better at comparing companies with different levels of debt.
Herman Miller's forward P/E multiple of 15.2x is above its entire peer group: HNI (15.0x), SCS (14.5x), KNL (13.1x) and ACCO (9.9x). In addition, the company's forward EBITDA multiple of 8.0x is above SCS (6.8x), KNL (7.7x) and ACCO (7.1x) and equal to HNI (8.0x).
source: finbox.io
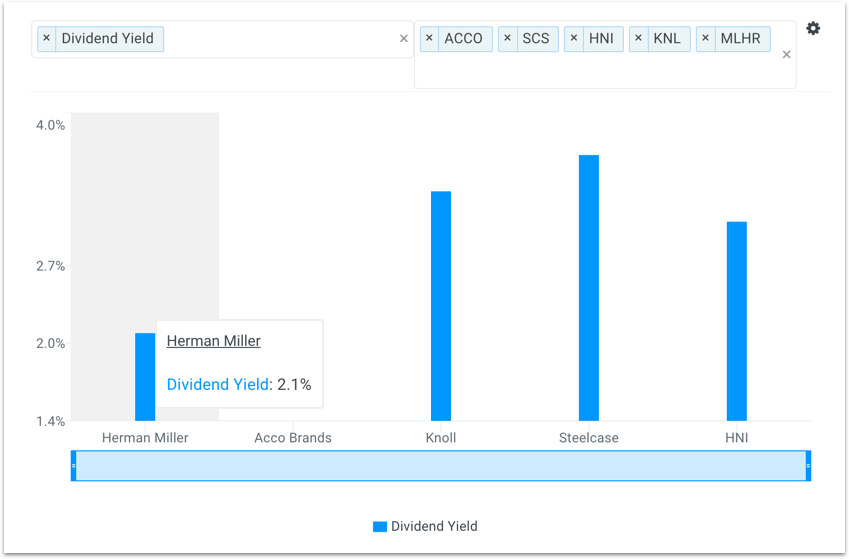
Dividend Yield represents cash returned to shareholders for each dollar invested. Dividend yield plus the change in stock price (capital gain) represents the total return on investment for shareholders. A stock with a high dividend yield is more attractive than a stock with a low dividend yield, all else being equal.
source: finbox.io
Herman Miller's dividend yield of 2.1% is below its entire peer group: HNI (3.0%), SCS (3.6%), KNL (3.3%) and ACCO which does not pay a dividend.
Value investors holding a position in Herman Miller shares should consider the above fundamentals prior to the company reporting earning on Wednesday.

Note this is not a buy or sell recommendation on any company mentioned.
Photo Credit: Google

