
I previously highlighted why Delta Air Lines was a winner among legacy carriers on August 22nd, 2017 when shares were trading at $47.80. The main arguments I highlighted were:
- the airline's strong capital structure,
- a healthy dividend, and
- management's initiative to deal with competition from Gulf state carriers.
Delta's stock has since increased by nearly 20% so I decided to update my cash flow analysis prior to the company reporting earnings on January 10th. The conservative analysis below details how Delta Air Lines, Inc. (NYSE: DAL) still has another 20% upside.
The DCF Methodology
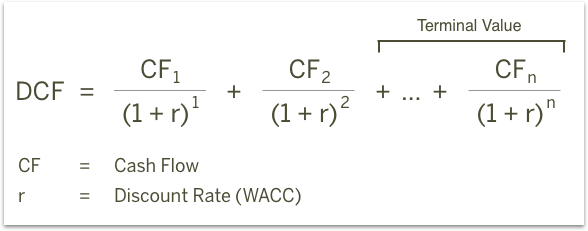
The basic philosophy behind a DCF analysis is that the intrinsic value of a company is equal to the future cash flows of that company, discounted back to present value. The general formula is provided below. The intrinsic value is considered the actual value or “true value” of an asset based on an individual’s underlying expectations and assumptions.
Cash flows into the firm in the form of revenue as the company sells its products and services, and cash flows out as it pays its cash operating expenses such as salaries or taxes (taxes are part of the definition for cash operating expenses for purposes of defining free cash flow, even though taxes aren’t generally considered a part of operating income). With the leftover cash, the firm will make short-term net investments in working capital (an example would be inventory and receivables) and longer-term investments in property, plant and equipment. The cash that remains is available to pay out to the firm’s investors: bondholders and common shareholders.
I will take you through my own expectations for Delta as well as explain how I arrived at certain assumptions. The full analysis was completed on Tuesday, January 2. An updated analysis using real-time data can be viewed in your web browser at finbox.io's Delta DCF analysis page. The steps involved in the valuation are:
1. Forecast Free Cash Flows
- Create a revenue forecast
- Forecast EBITDA profit margin
- Forecast depreciation & amortization expenses
- Select a pro-forma tax rate
- Plan/estimate capital expenditures
- Forecast net working capital investment
- Calculate free cash flow
2. Select a discount rate
3. Estimate a terminal value
4. Calculate the equity value
Step 1: Forecast Free Cash Flows
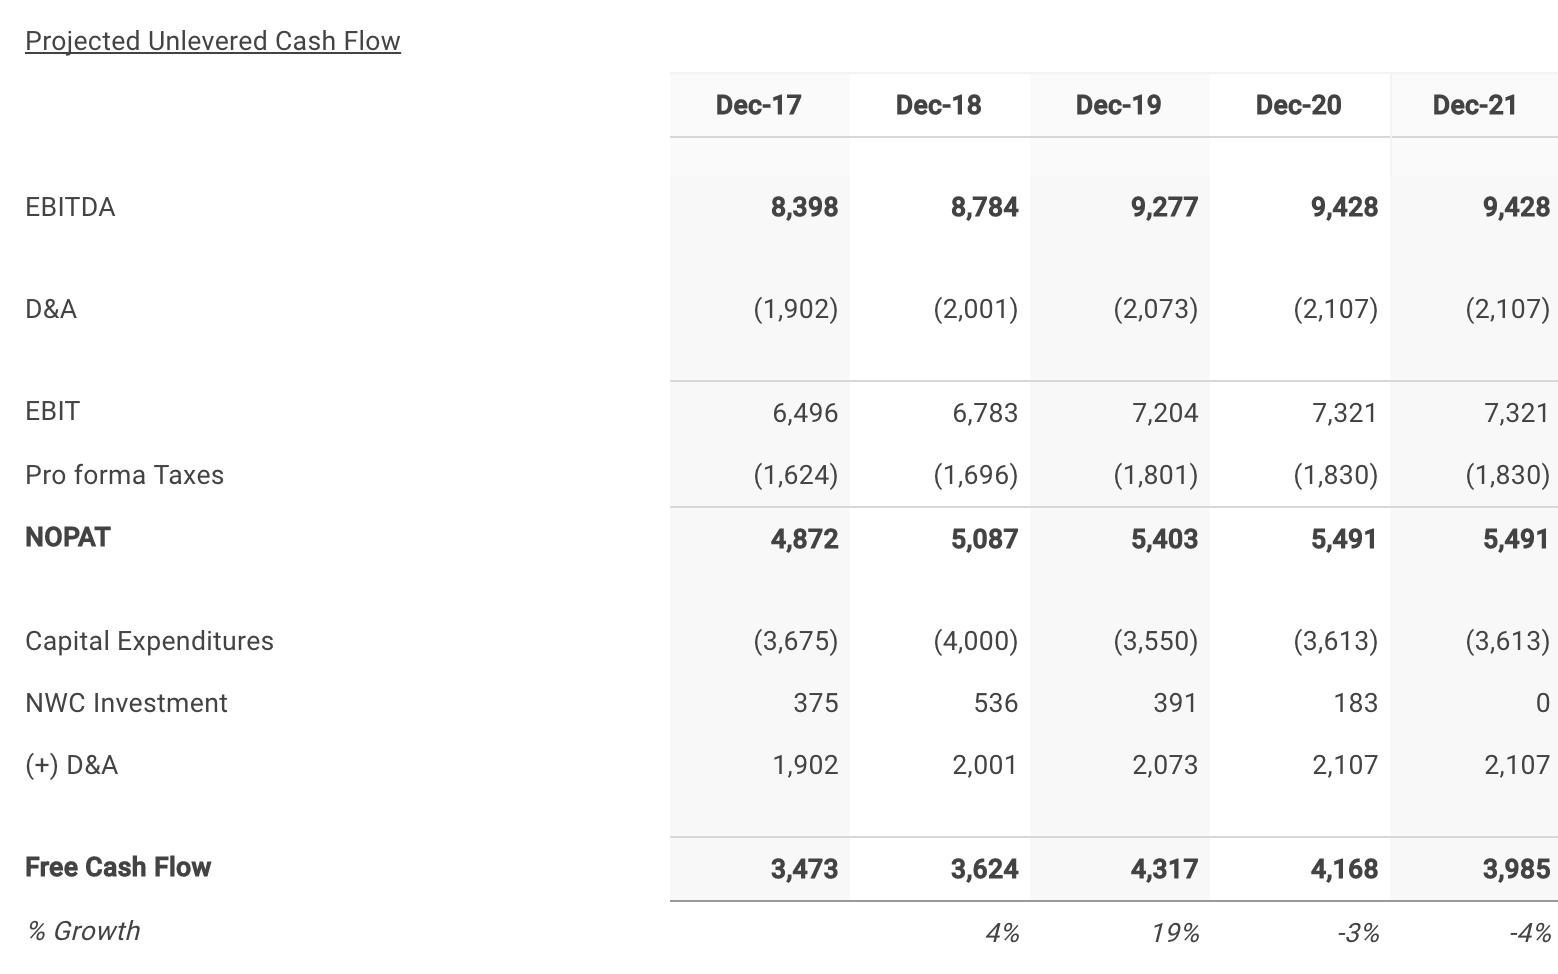
The key assumptions that have the greatest impact on cash flow projections are typically related to growth, profit margin and investments in the business. The analysis starts at the top of the income statement by creating a forecast for revenue and then works its way down to net operating profit after tax (NOPAT), as shown below.
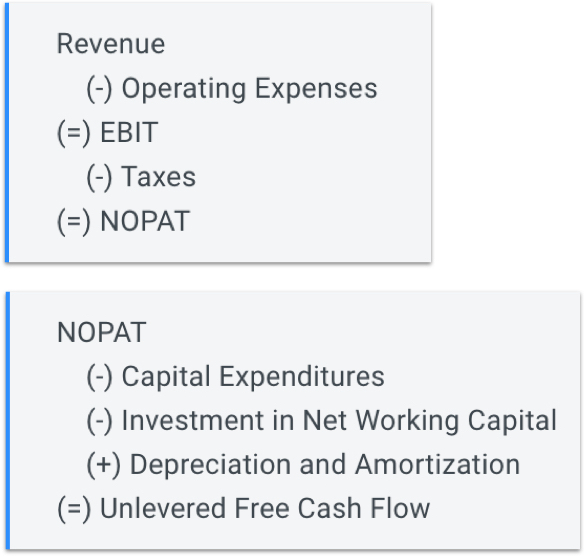
From NOPAT, deduct cash outflows like capital expenditures and investments in net working capital and add back non-cash expenses from the income statement such as depreciation and amortization to calculate the unlevered free cash flow forecast (shown above).
Capital expenditures or fixed capital investment does not appear on the income statement, but it does represent cash leaving the firm, which is why it is subtracted from NOPAT to reach free cash flow. Capital expenditures used in the DCF model represent a net amount, meaning the figure is calculated by subtracting proceeds from sales of long-term assets from capital expenditures. It is the change in capital expenditures that matters for this model.
Working capital is often used as a measure of a company’s efficiency and short-term financial health. It is generally calculated as current assets minus current liabilities.
Working capital investment, or net working capital, in the DCF model is equal to the change in working capital, excluding cash, cash equivalents, notes payable, and the current portion of long-term debt. It’s important to note that one would add the change in working capital to NOPAT if there was a reduction in working capital over the period. It would be added back because it represents a cash inflow. This concept is confusing to many. An increase in working capital implies that more cash is invested in working capital and thus reduces cash flow. Firms with significant working capital requirements will find that their working capital grows as they do, and this working capital growth will reduce their cash flows. It is more common to see a cash outflow for the change in net working capital.
Non-cash charges are added back to NOPAT to arrive at free cash flow because they represent accounting losses required to be reported on the income statement but they didn’t actually result in an outflow of cash. The most significant recurring non-cash charges are typically depreciation and amortization. But other non-cash charges or expenses that are typically non-recurring in nature could include:
- Amortization of intangibles,
- Goodwill impairment,
- Asset write-down,
- Provisions for restructuring charges and other non-cash losses (these expected losses should reduce future free cash flow accordingly in the model’s estimates),
- Income from restructuring charge reversals and other non-cash gains,
- Amortization of a bond discount (add back to net income to calculate free cash flow),
- Accretion of a bond premium (subtract from net income to calculate free cash flow),
- Deferred taxes (if you expect that deferred taxes will continue to increase in the future),
- Acquisition expenses representing the costs involved in acquiring a business or a customer (can be cash or non-cash expenses), and
- Litigation expenses relating to legal matters such as settlements and patents.
Finbox.io’s valuation models retroactively adjust historical financials to exclude these non-recurring items. We exclude these items to gain a better sense of how the company has performed in its normal course of business and since they are typically non-recurring charges, their exclusion helps provide a “cleaner” picture for comparing historical performance to projected performance.
Create A Revenue Forecast
When available, the finbox.io’s pre-built models use analyst forecasts as the starting assumptions. To forecast revenue, analysts gather data about the company, its customers and the state of the industry. I typically review the analysts’ forecast and modify the growth rates based on historical performance, news and other insights gathered from competitors. Note that if a company only has a small number of analysts giving projections, the consensus forecast tends to not be as reliable as companies that have several analysts’ estimates. Another check for reliability is to analyze the range of estimates. If the range is really wide, it may be less accurate.
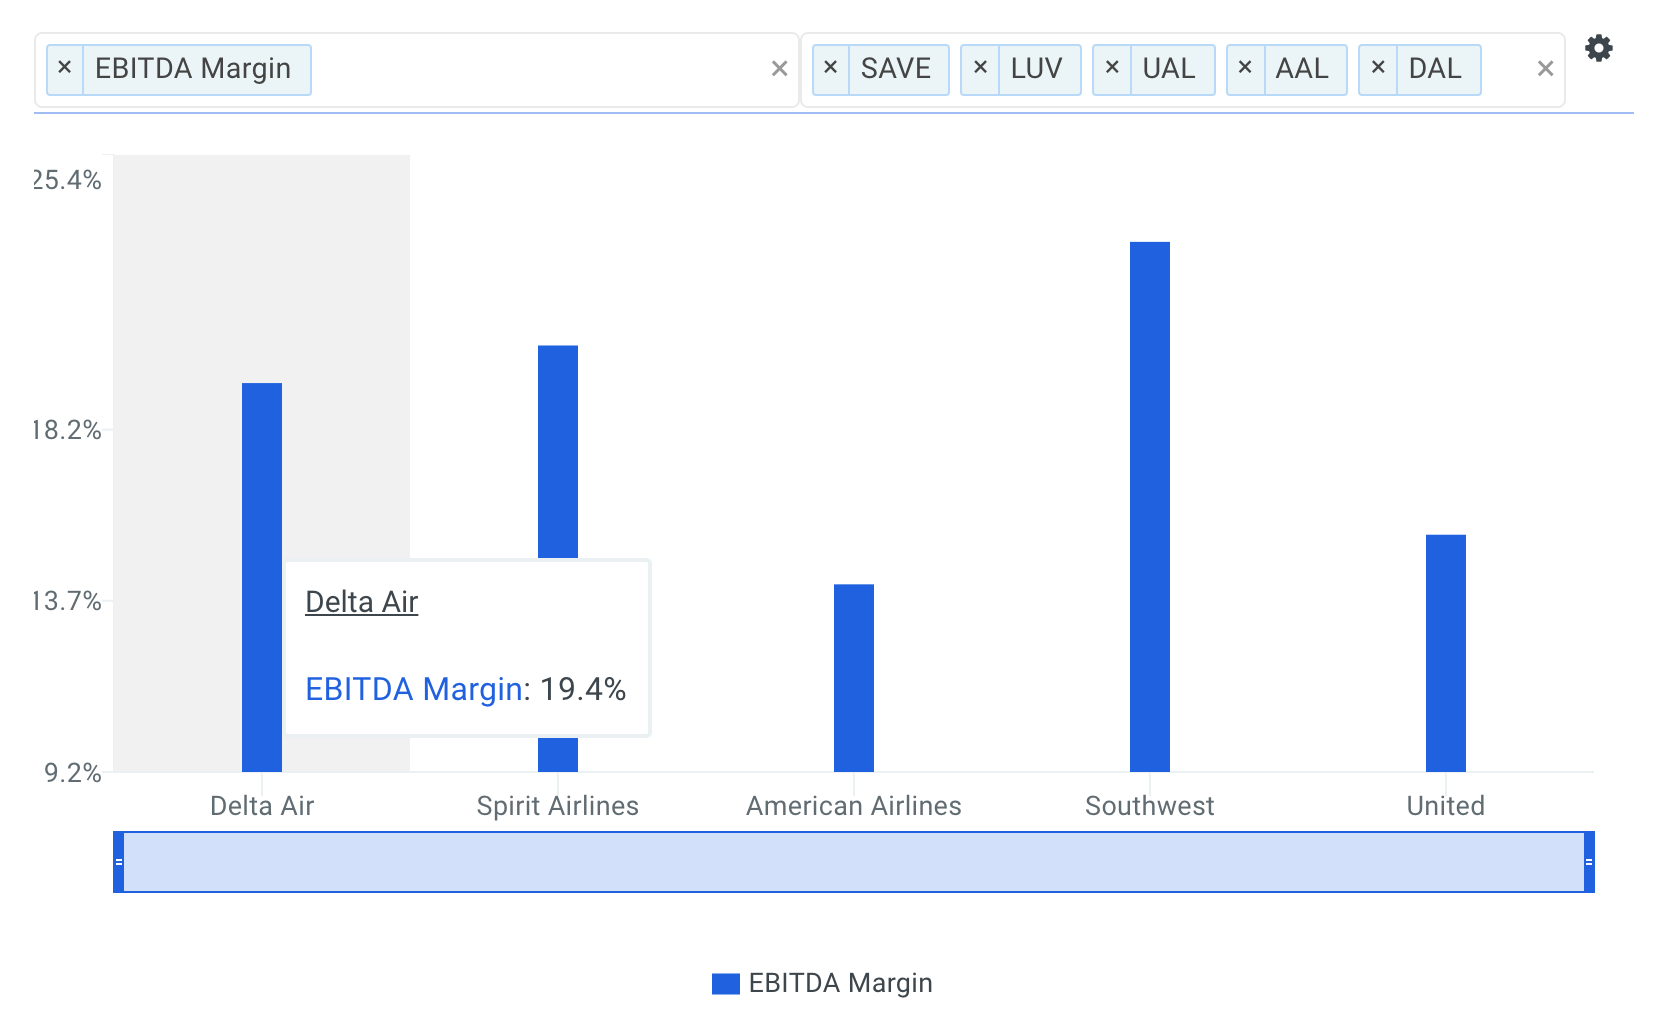
Analysts covering the stock often compare the company to a peer group that includes United Continental Holdings, (NYSE: UAL), Southwest Airlines (NYSE: LUV), American Airlines Group, (NasdaqGS: AAL) and Spirit Airlines, (NasdaqGS: SAVE).
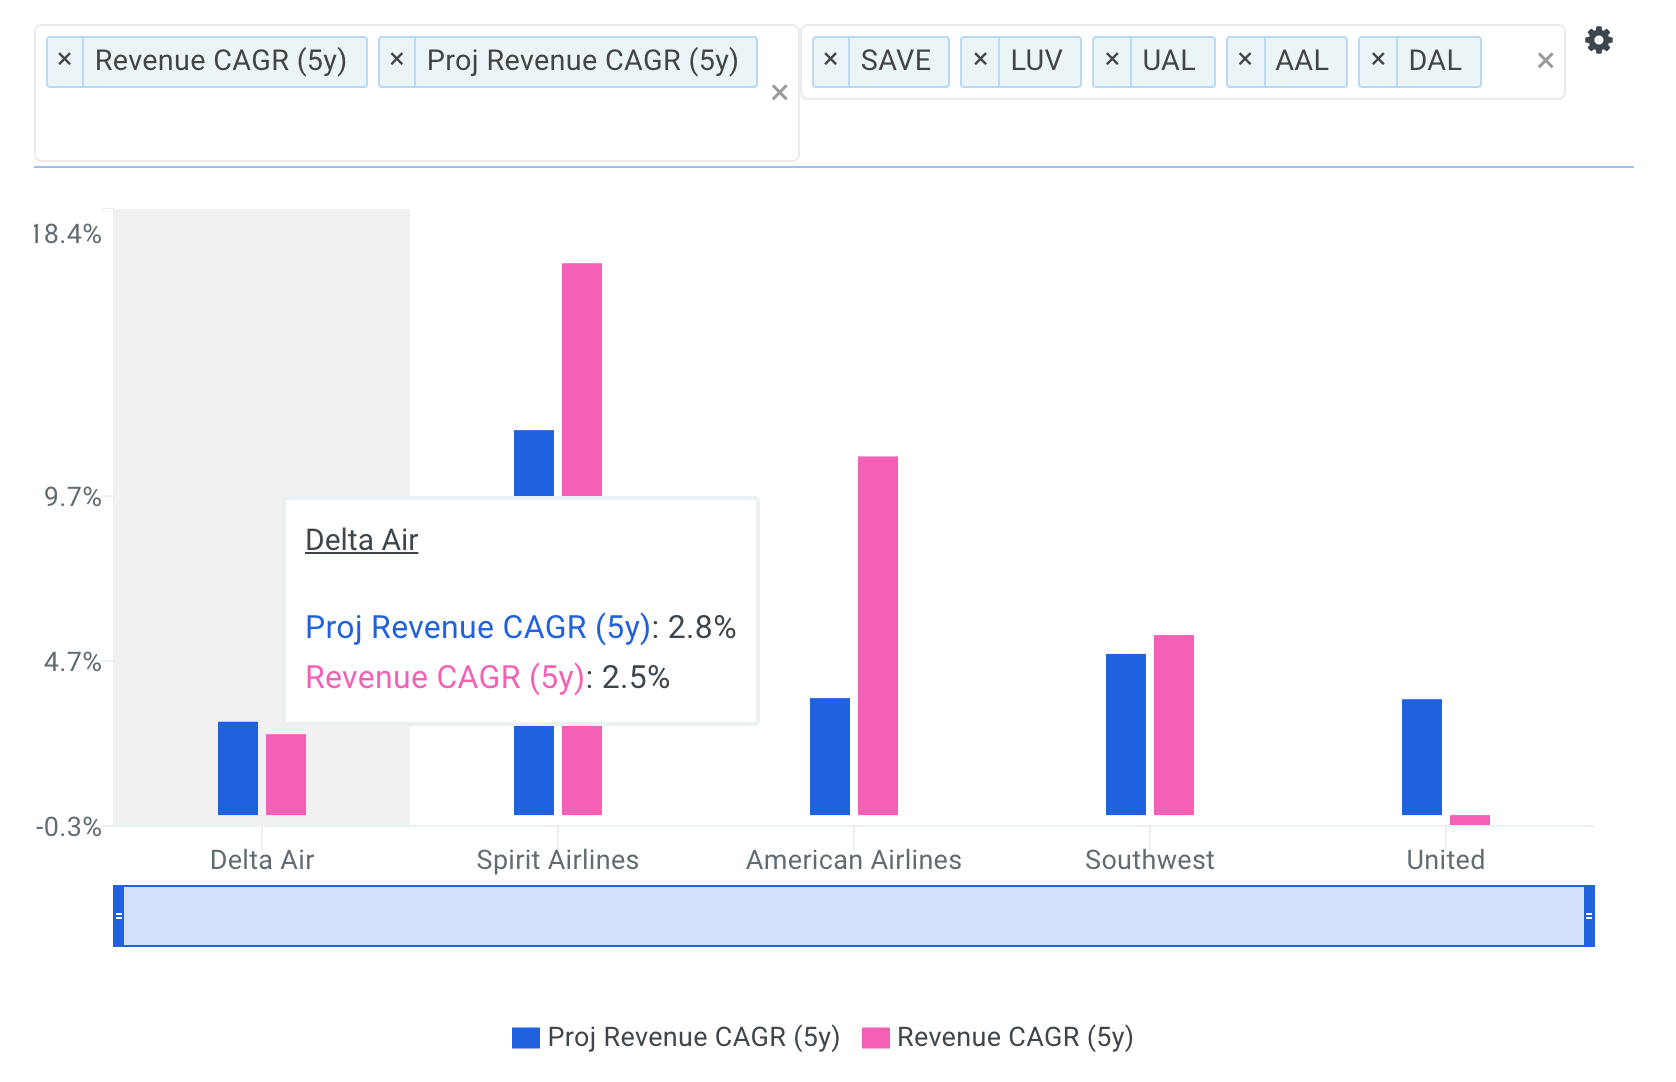
The company's 5-year revenue CAGR of 2.5% is only above selected comparable public company UAL (-0.3%) and below LUV (5.5%), AAL (10.9%) and SAVE (16.7%). The company's projected 5-year revenue CAGR of 2.8% is below all of its selected comparable public companies: UAL (3.5%), LUV (4.9%), AAL (3.5%) and SAVE (11.7%).
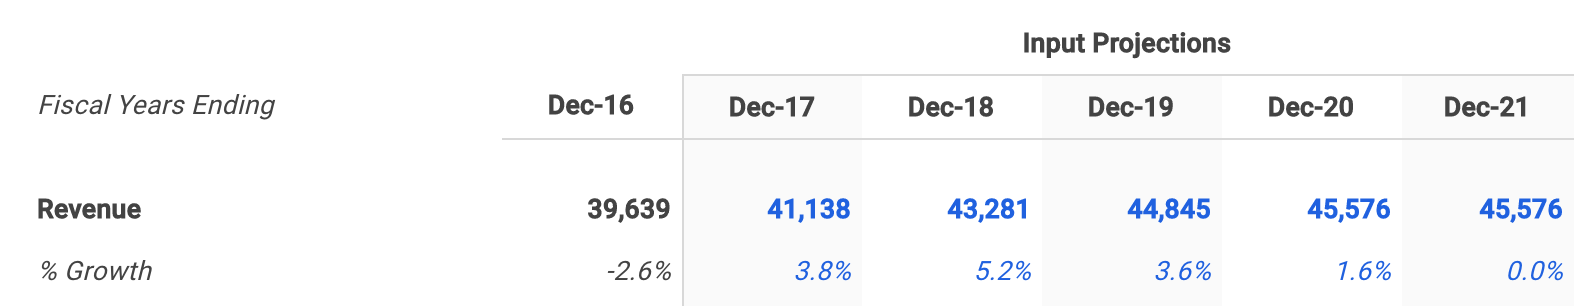
As highlighted below, Delta's revenue growth has ranged from -2.6% to 10.6% over the last five fiscal years.
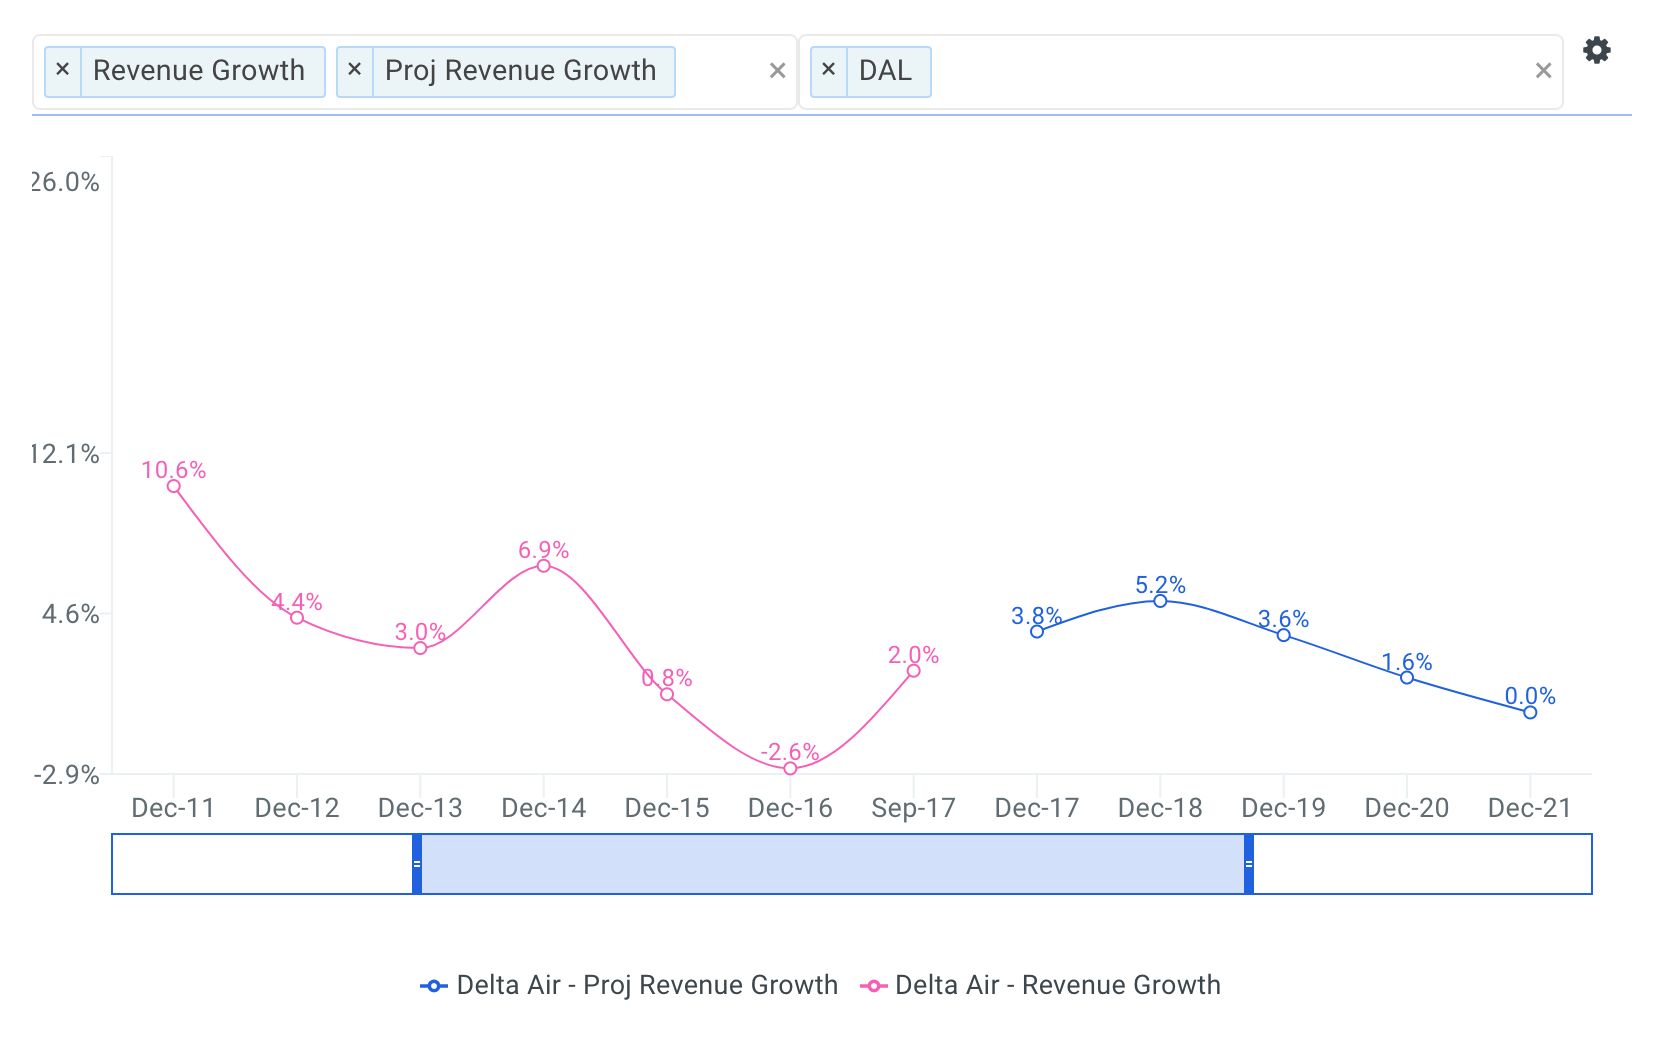
Going forward, analysts forecast that Delta's total revenue will reach $45,576 million by fiscal year 2021 representing a five-year CAGR of 2.8%.
I keep these conservative assumptions in my model, which is shown below.
Forecast Delta's EBITDA Profit Margin
The next step is to forecast the company’s earnings before interest, taxes, depreciation and amortization (EBITDA). Note that EBITDA is a commonly used metric in valuation models because it provides a cleaner picture of overall profitability, especially when benchmarking against comparable companies. This is because it ignores non-operating costs that can be affected by certain items such as a company’s financing decisions or political jurisdictions. For more detail, see Delta's EBITDA definition.
EBITDA margin is calculated by dividing EBITDA by revenue. The higher the EBITDA margin, the smaller the firm’s operating expenses are in relation to its revenue, which may ultimately lead to higher profit. Lower operating expenses for a given level of revenue can be a sign of internal economies of scale.
The charts below compare Delta's LTM EBITDA margin to the same peer group. The company's EBITDA margin of 19.4% is above its selected comparable public companies: UAL (15.4%), AAL (14.1%) and below LUV (23.1%) and SAVE (20.4%).
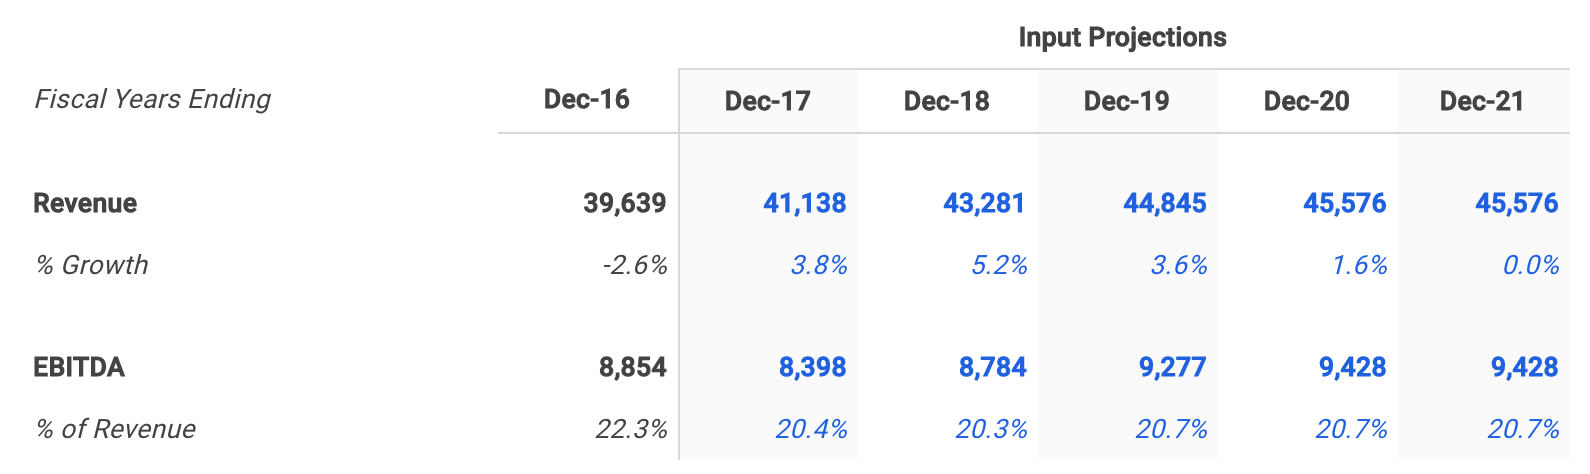
Delta's EBITDA margin has ranged from 9.9% to 23.7% over the last five fiscal years. Wall Street analysts are forecasting that Delta's EBITDA margin will reach 20.7% by fiscal year 2021, representing an increase of 1.3% from its LTM EBITDA margin of 19.4%.
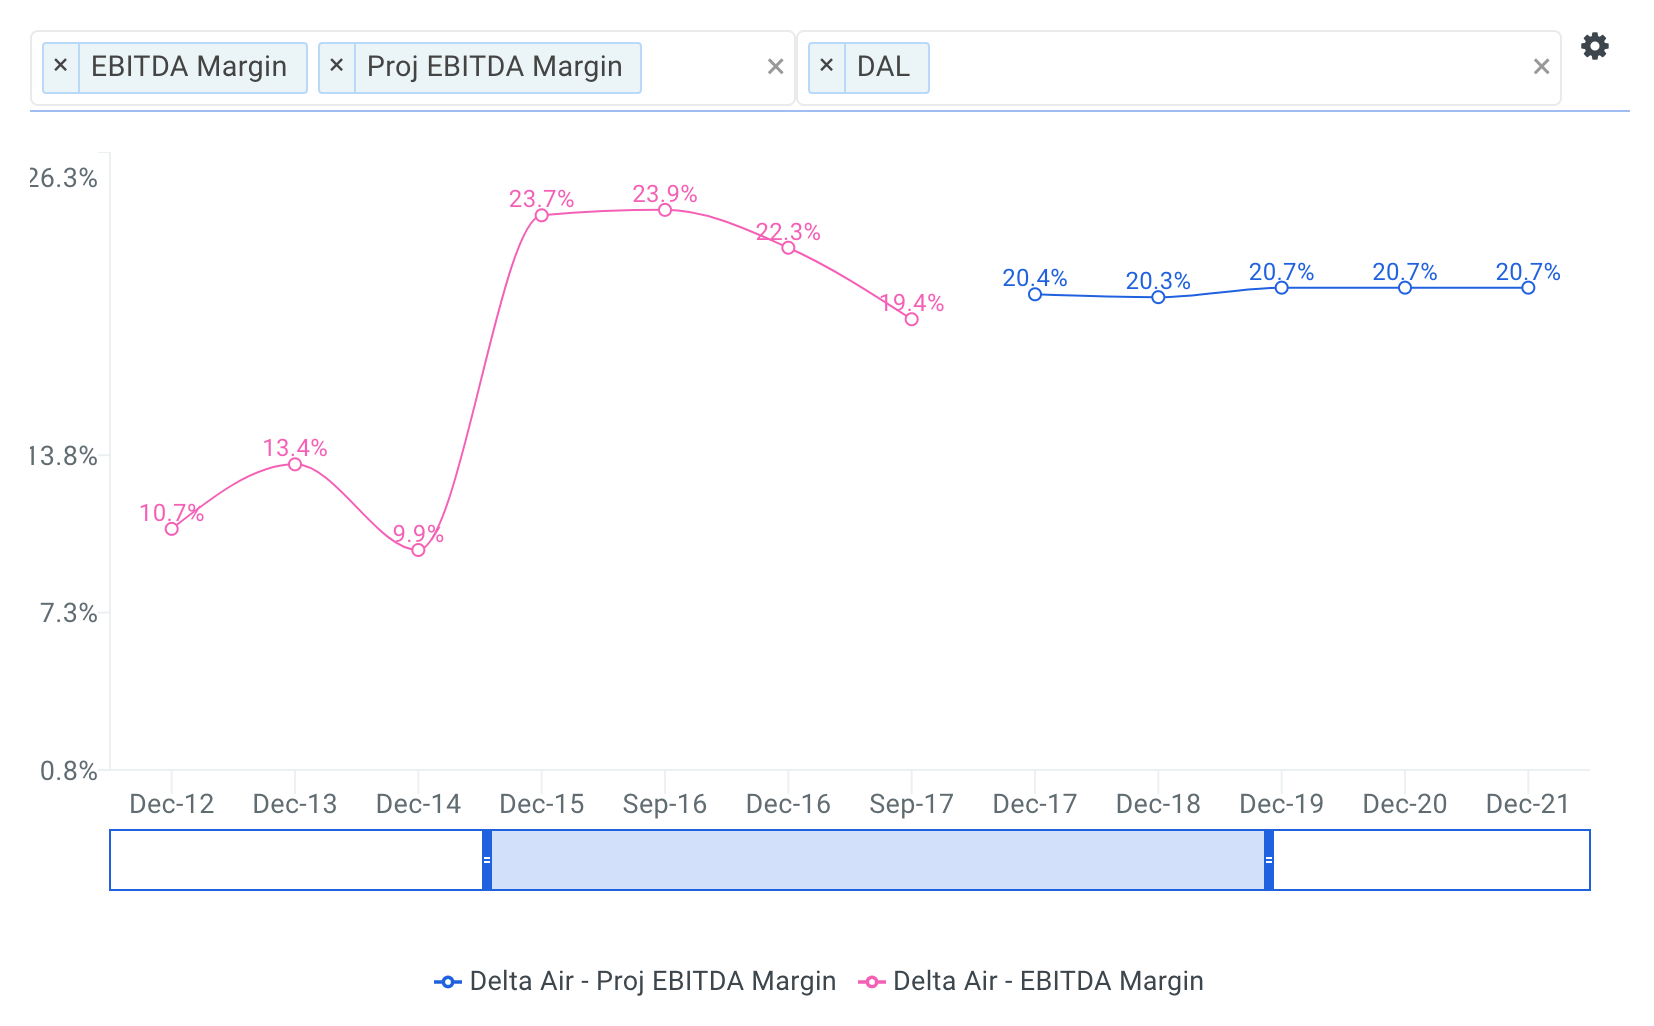
These assumptions seem very reasonable based on historical performance so I, again, kept them in my model shown below.
Forecast Depreciation & Amortization Expenses
Depreciation and amortization (D&A) are usually embedded in cost of goods sold (COGS) or selling general and administrative expenses (SG&A) on the income statement. The model subtracts D&A to estimate NOPAT but eventually adds it back in the build-up to free cash flow because it’s a non-cash expense. Including it as an expense in the calculation of NOPAT allows the model to capture the tax benefits associated with D&A. While depreciation is a non-cash expense, the firm reduces its tax bill by expensing it, so the free cash flow available is increased by the tax savings.
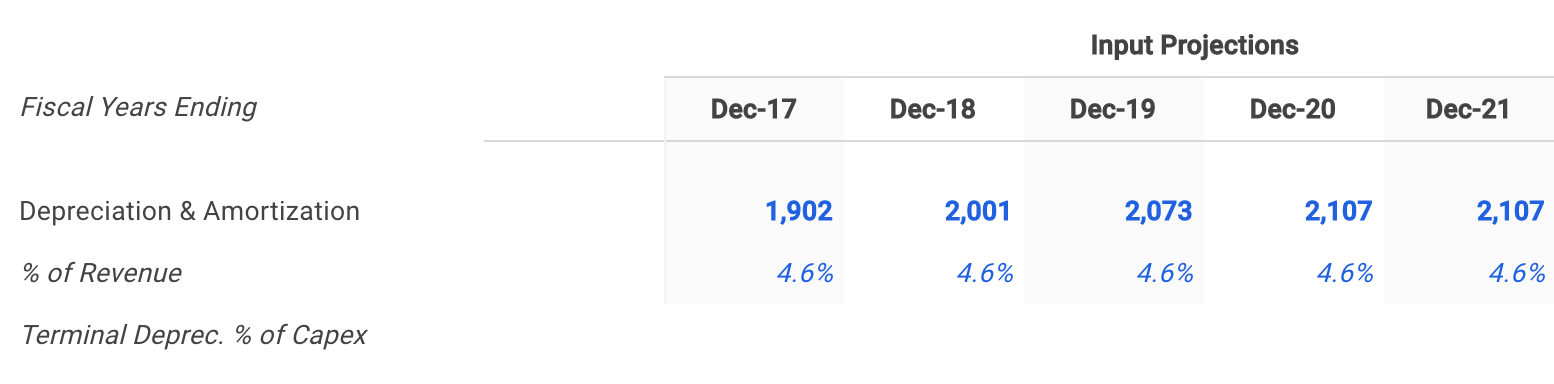
Delta's historical and forecasted D&A is shown in the charts below.
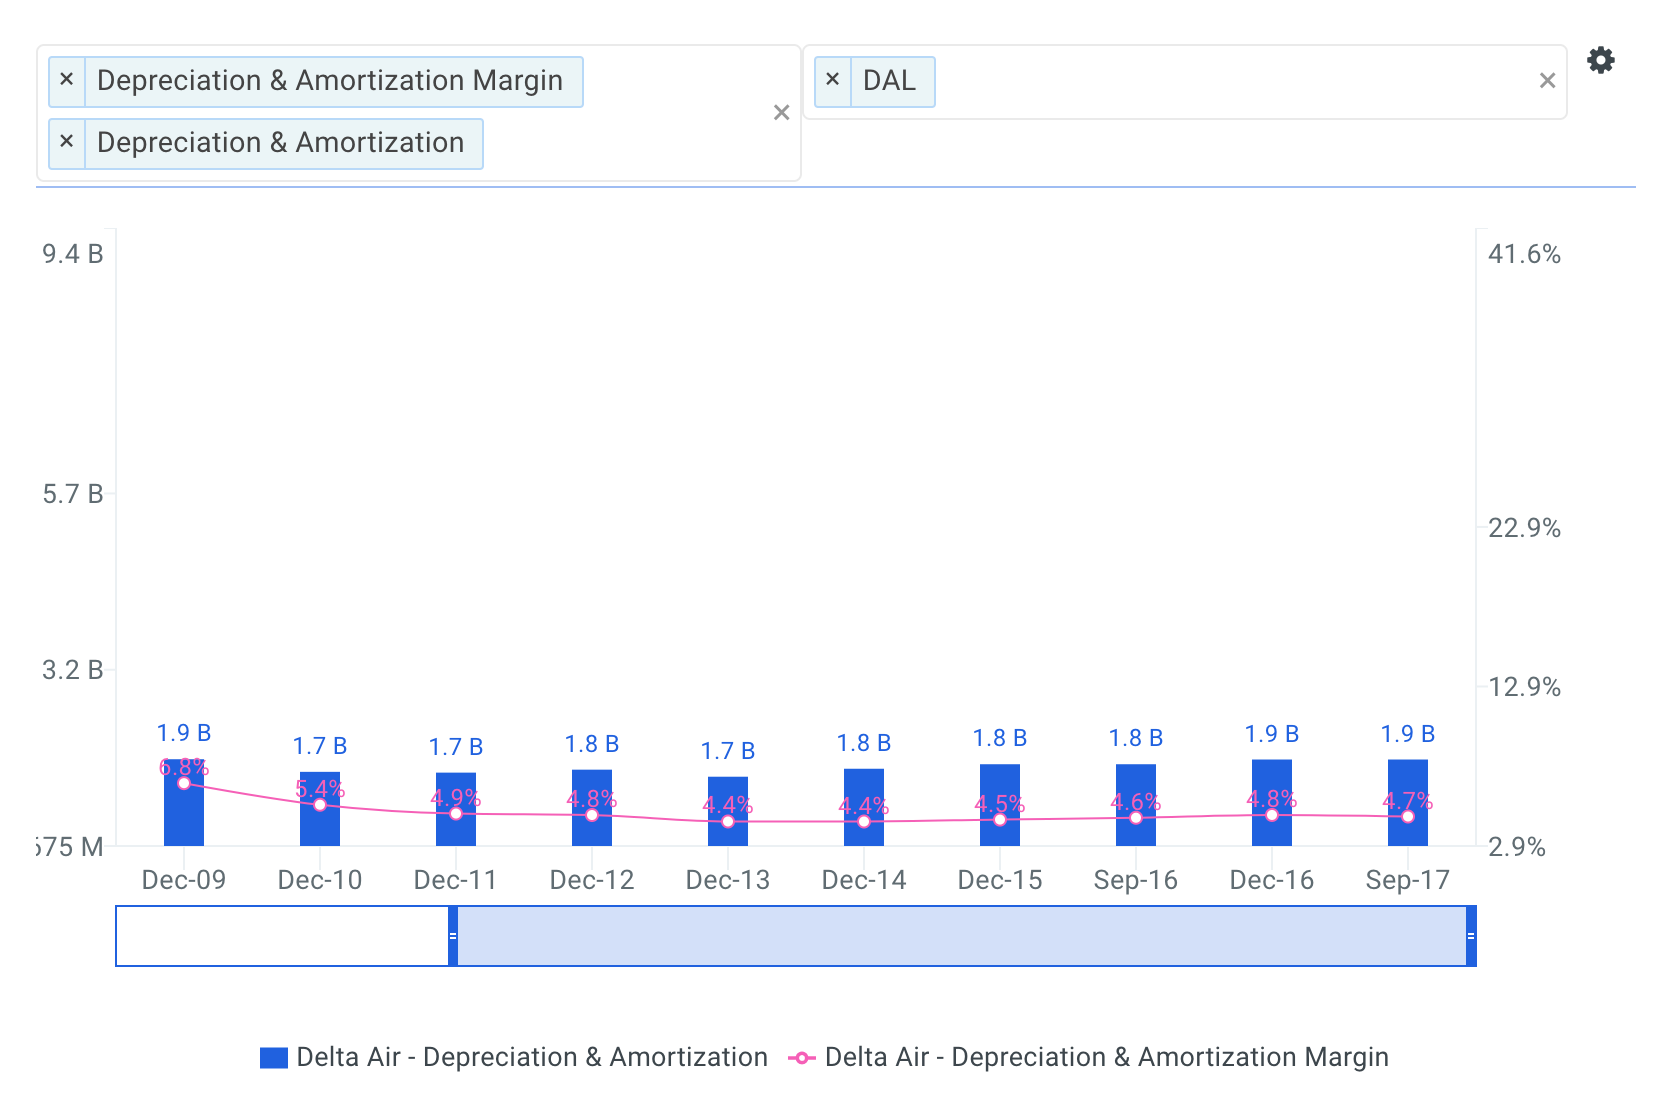
I’ve kept D&A at 4.6% of revenues throughout the projection period, which is in line with its past performance.
Select a Pro Forma Tax Rate
Companies are required to pay a portion of their profits to the governments in the countries in which they operate. A firm’s effective tax rate is calculated from the reported income statement by dividing taxes by operating income before taxes. The marginal tax rate is the rate owed on the company’s last dollar of taxable income. A company’s effective and marginal tax rate is not always the same due to accounting standards related to tax credits, tax deferrals and net operating losses (NOLs) carried forward. However, historical effective tax rates are useful for estimating a company’s marginal tax rate, which is what I use in the model.
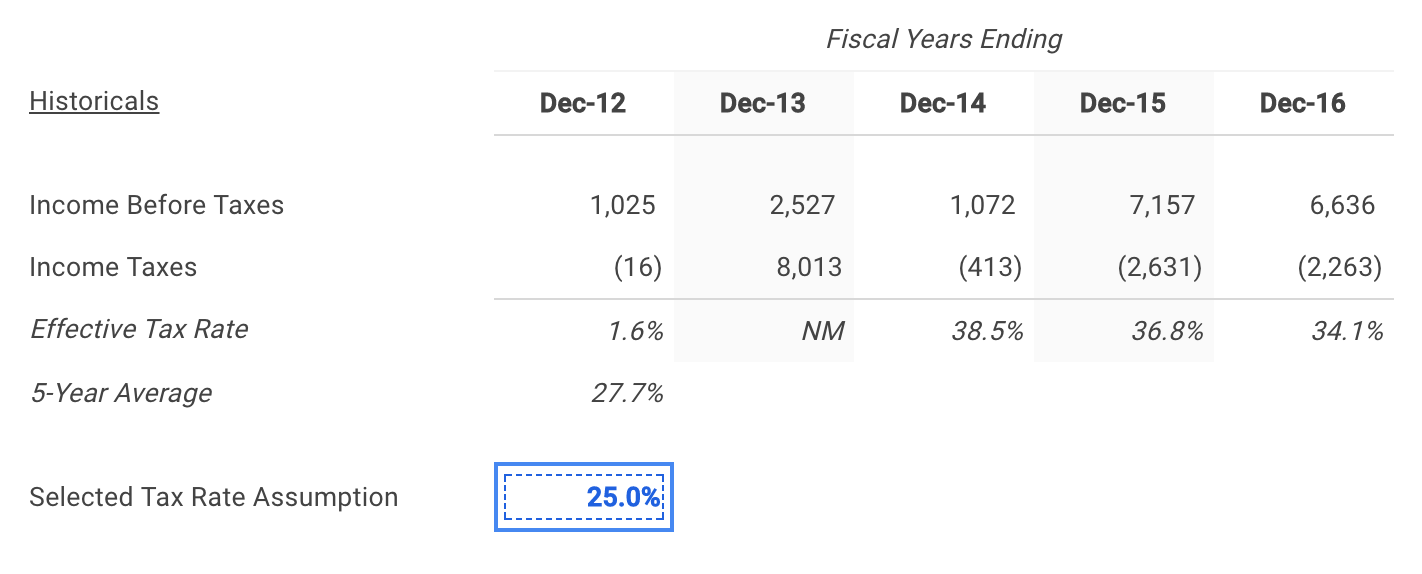
Delta along with many other companies report their effective tax rates in their quarterly and annual reports. The company's effective tax rate and my selected assumption are highlighted below.
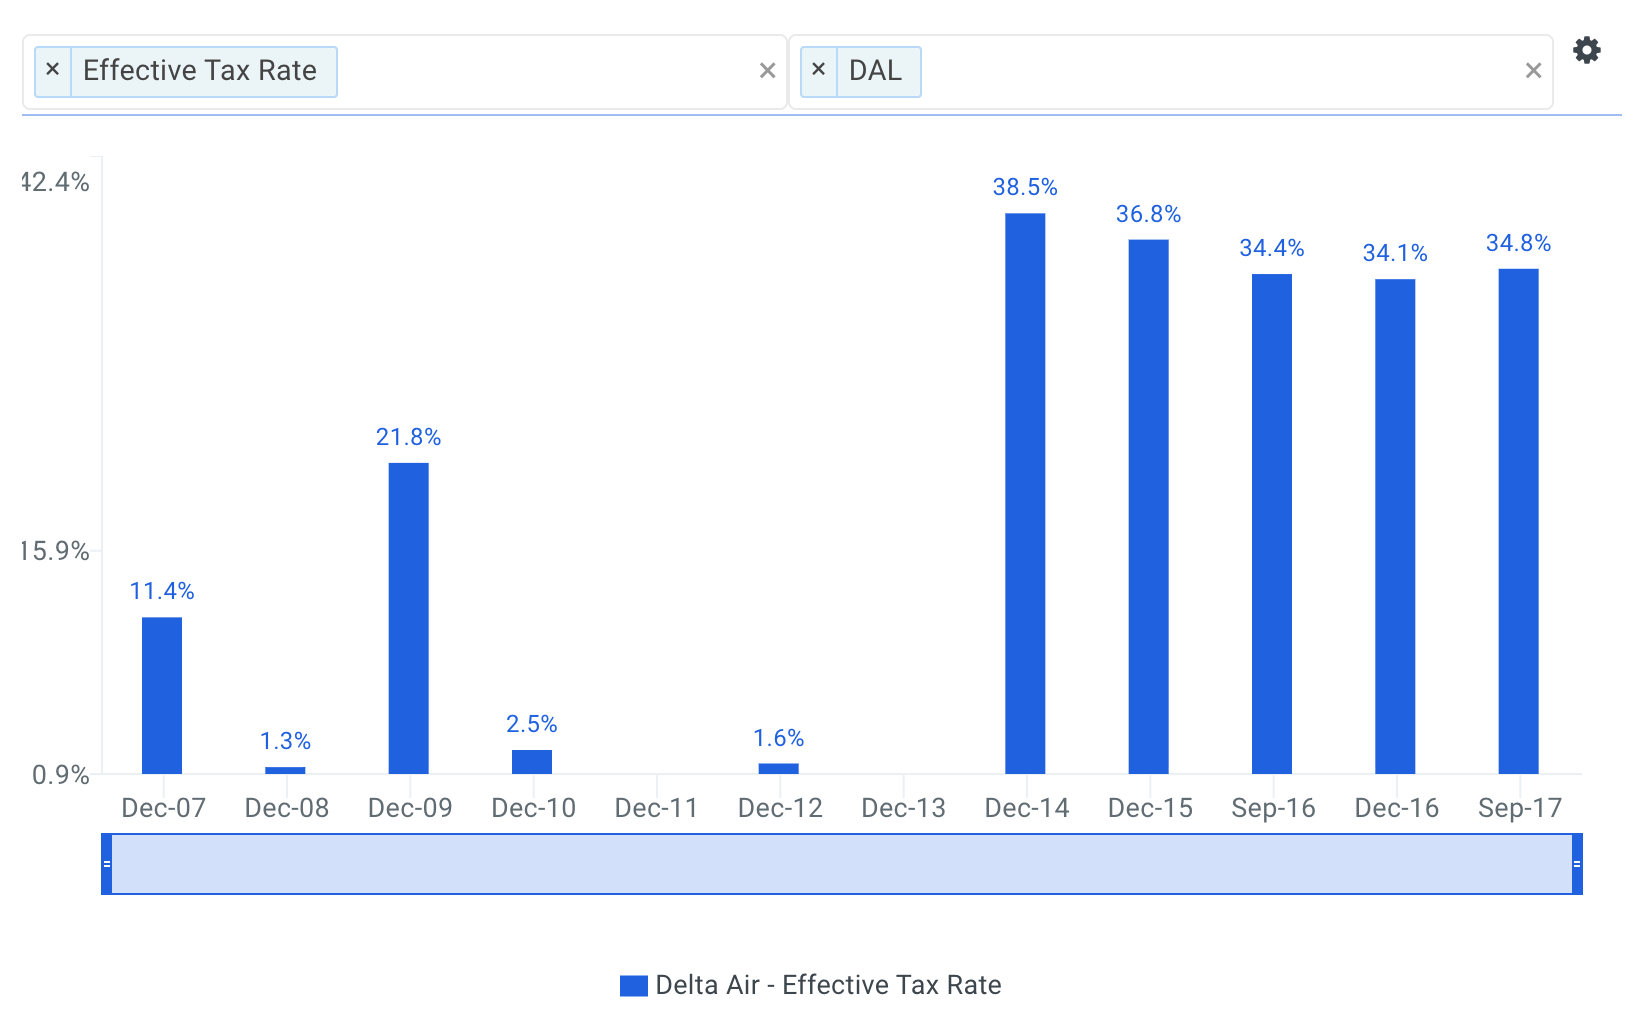
Note that President Trump signed a massive GOP tax bill into law right before Christmas bringing the corporate tax rate down from 35% to 21%. Therefore, historical tax rates are not indicative of what will be paid by companies going forward.
State and local taxes vary by jurisdiction so I selected a higher and more conservative 25% tax rate for Delta.
Value investors may also want to check out these high tax paying stocks with big upside.
Plan Capital Expenditures
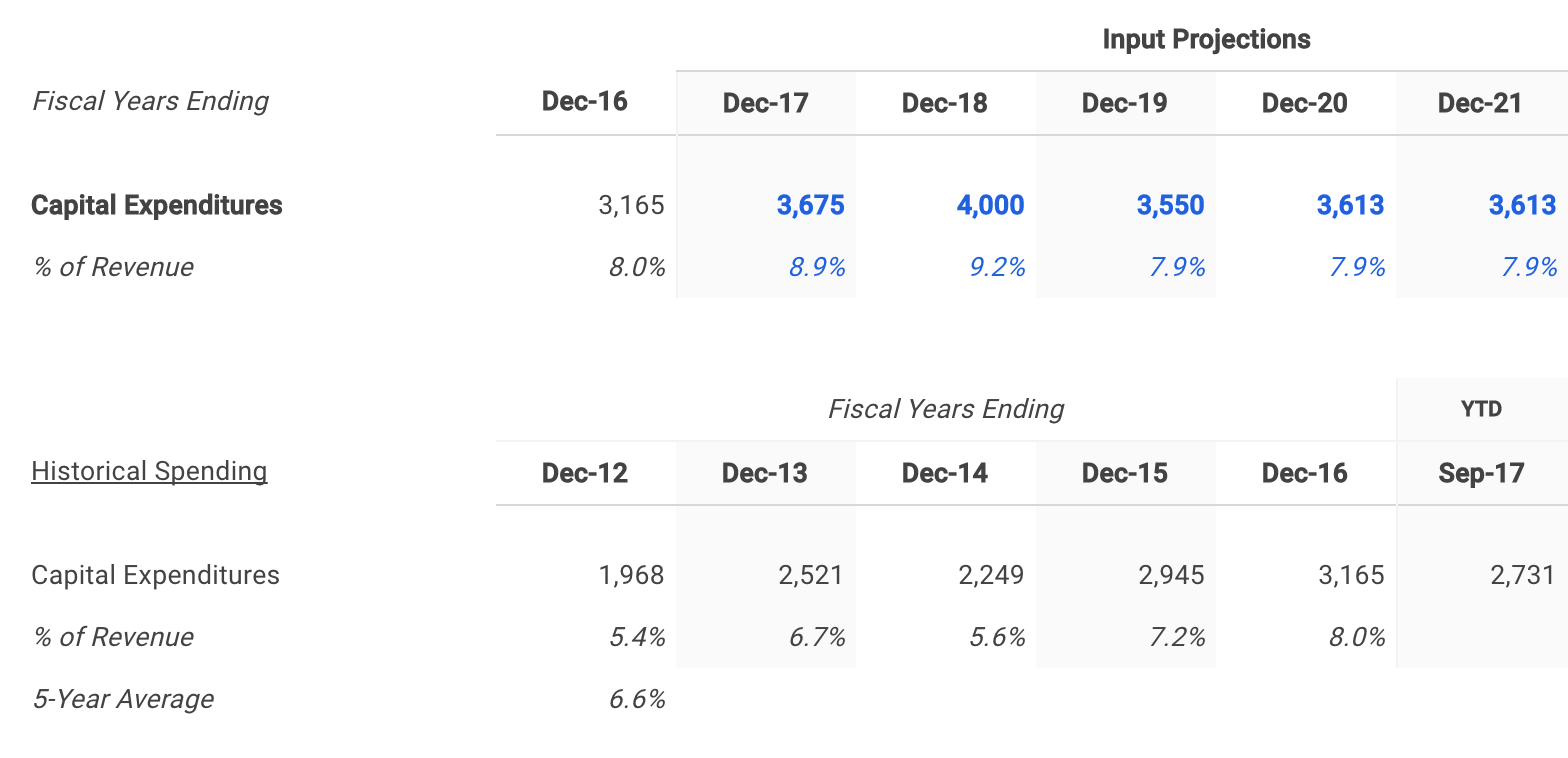
Spending on plant, property, and equipment (PP&E), which is often referred to as capital expenditures allows a firm to continue to operate as well as grow its operations. The amount that Delta has spent (as a percentage of revenue) has ranged from 5.4% to 8.0% over the last five fiscal years.
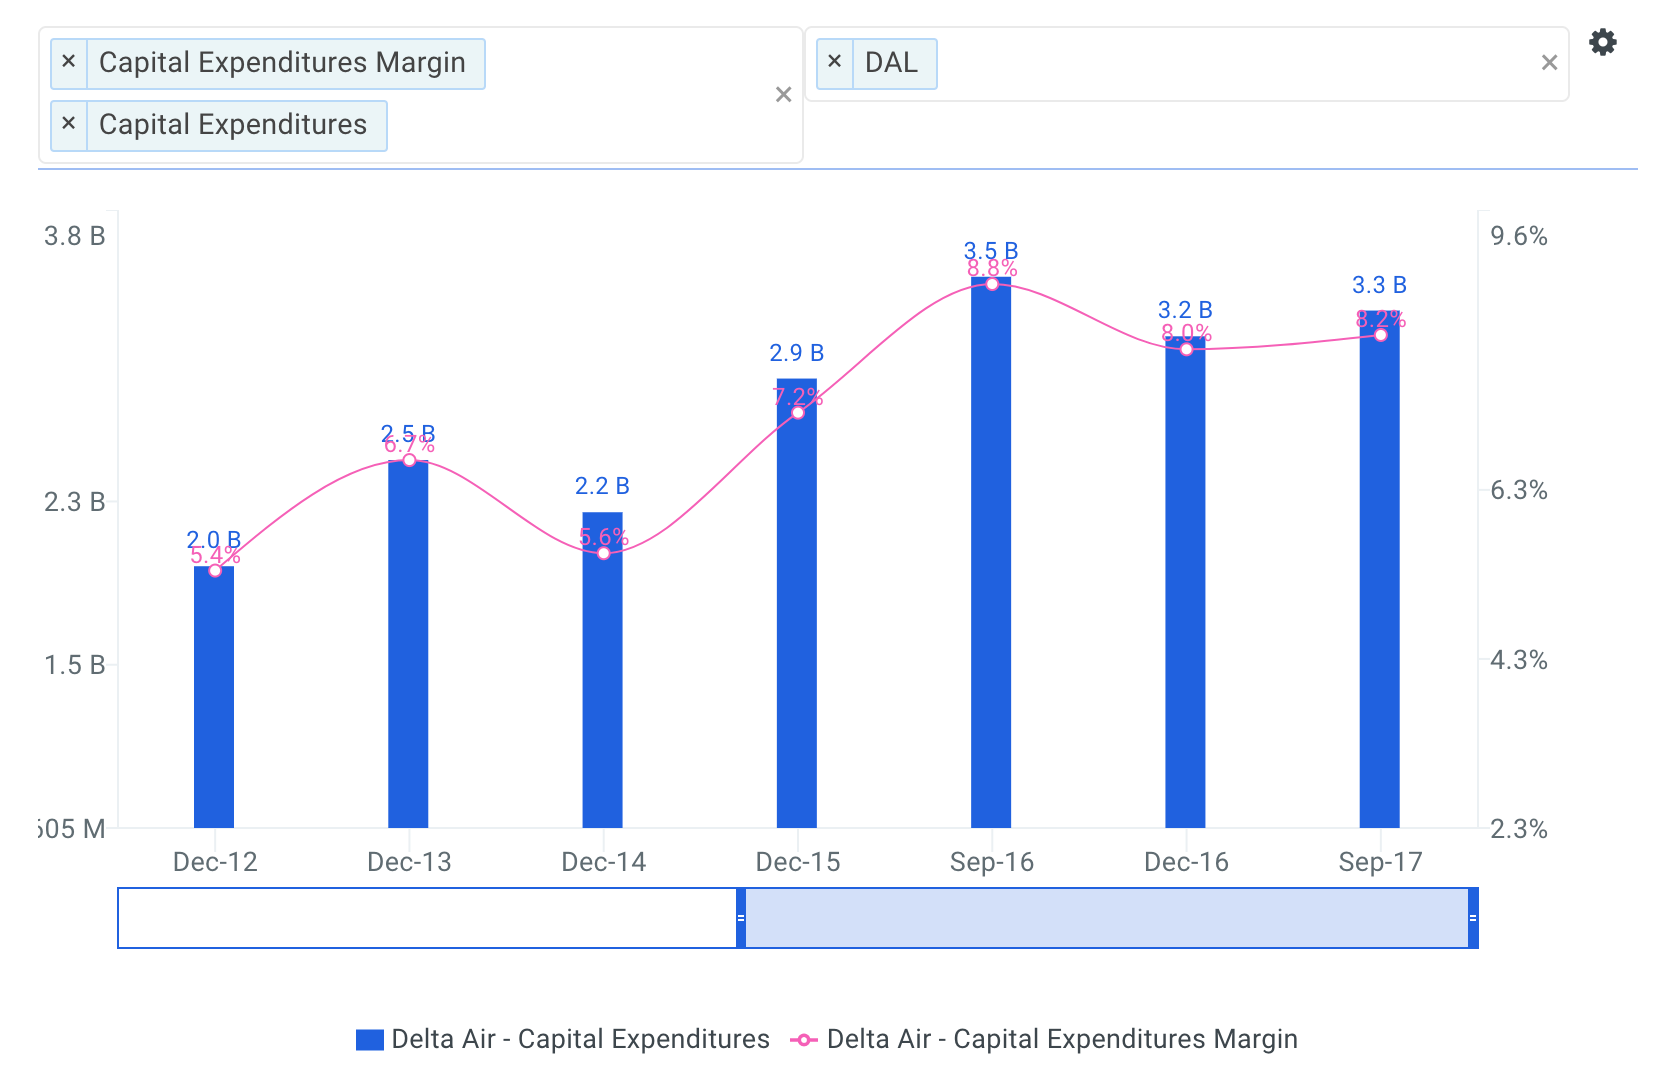
I apply Wall Street's consensus estimates below that call for Delta's capex margin to reach a high of 9.2% this year before falling to 7.9% the remainder of the projection period.
Forecast Net Working Capital Investment
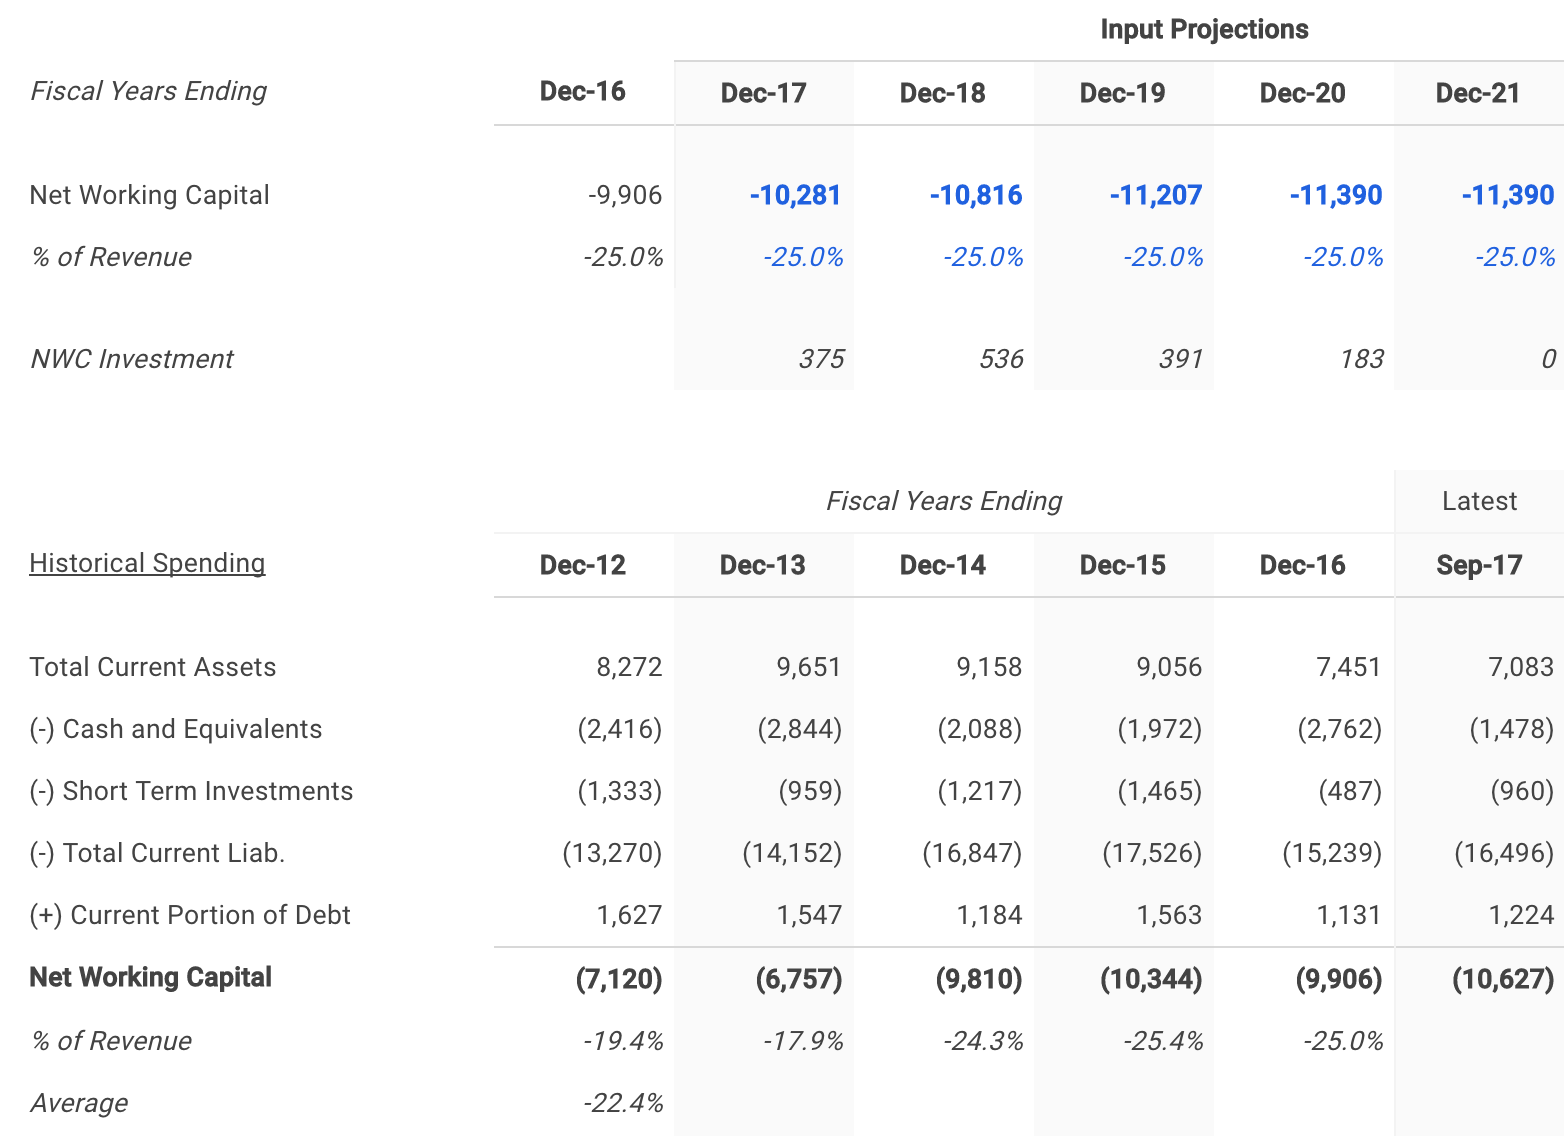
As a company grows, it typically needs to tie up more cash in working capital to manage its day-to-day operations effectively. The model accounts for the impact of this investment by first estimating Delta's net working capital (NWC) as a percentage of revenue and then deducting year-over-year increases from free cash flow.
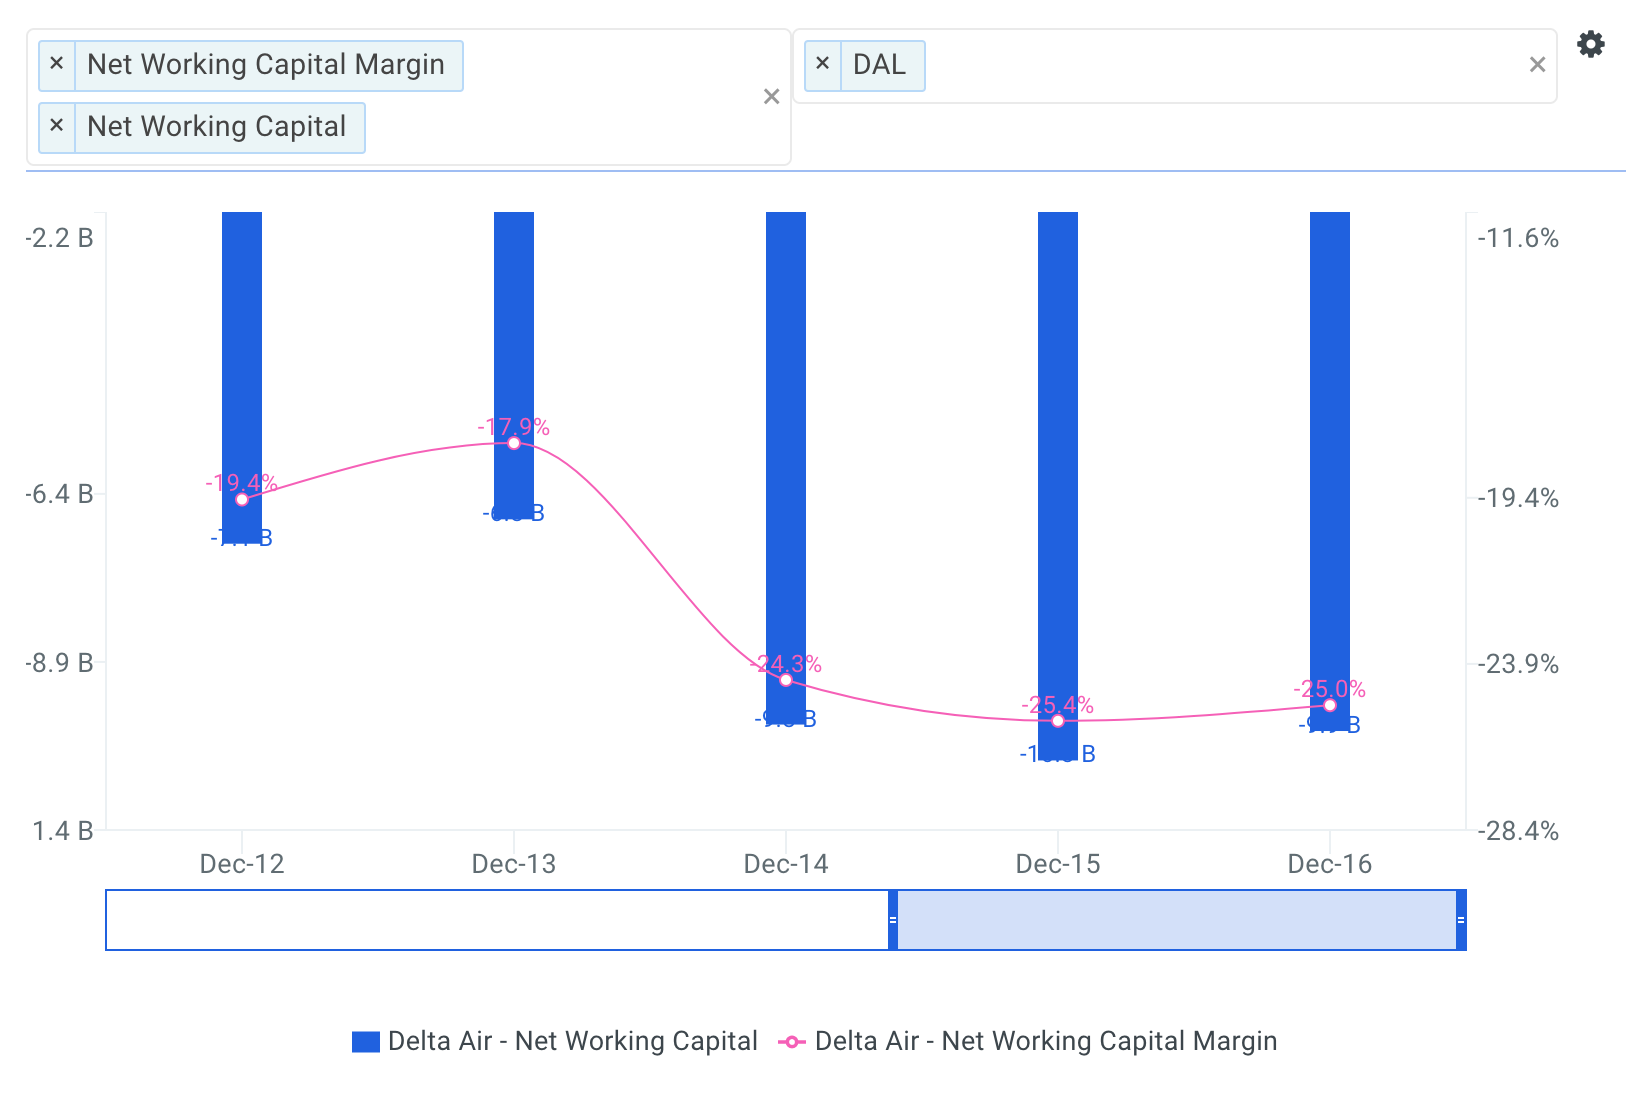
It is important to note that net working capital typically fluctuates more year over year than other DCF assumptions and is generally more difficult to project with as much confidence. Delta has historically required -22.4% of revenue on average for net working capital, but this figure has been as high as -17.9% and as low as -25.4%. The company’s latest fiscal-year NWC margin of -25.0% is in the ballpark, so I kept it at that level in the forecast shown in the figure below.
Calculate Free Cash Flow
With all required forecasts in place, the next step is to calculate projected free cash flow as shown below.
Step 2: Select Delta's Discount Rate
The next step is to select a discount rate to calculate the present value of the forecasted free cash flows. I used finbox.io’s Weighted Average Cost of Capital (WACC) model to help arrive at an estimate. Generally, a company’s assets are financed by either debt (debt is after tax in the formula) or equity. WACC is the average return expected by these capital providers, each weighted by respective usage. The WACC is the required return on the firm’s assets.
It’s important to note that the WACC is the appropriate discount rate to use because this analysis calculates the free cash flow available to Delta’s bondholders and common shareholders. On the other hand, the cost of equity would be the appropriate discount rate if we were calculating cash flows available only to Delta’s common shareholders (i.e., dividend discount model, equity DCF). This is commonly referred to as the difference between free cash flow to equity (FCFE) and free cash flow to the firm (FCFF). By using the WACC to discount FCFF, we are calculating total firm value. If we discounted FCFE at the required return on equity, we would end up with equity value of the firm. Equity value of the firm is simply total firm value minus the market value of debt.
I determined a reasonable WACC estimate for Delta to be 8.0% at the midpoint. An updated cost of capital analysis using real-time data can be found at finbox.io's Delta WACC Model Page. The DCF model then does the heavy lifting of calculating the discount factors by applying the mid-year convention technique.
Step 3: Estimate Delta's Terminal Value
Since it is not reasonable to expect that Delta will cease its operations at the end of the five-year forecast period, we must estimate the company’s continuing value, or terminal value. Terminal value is an important part of the DCF model because it accounts for the largest percentage of the calculated present value of the firm. If you were to exclude the terminal value, you would be excluding all the future cash flow past the horizon period. Using finbox.io, users can choose a five-year or 10-year horizon period to forecast future free cash flow.
The most generally accepted techniques to calculate a terminal value are by applying the Gordon growth approach, using an EBITDA exit multiple and using a revenue exit multiple. This analysis applies the Gordon growth formula:
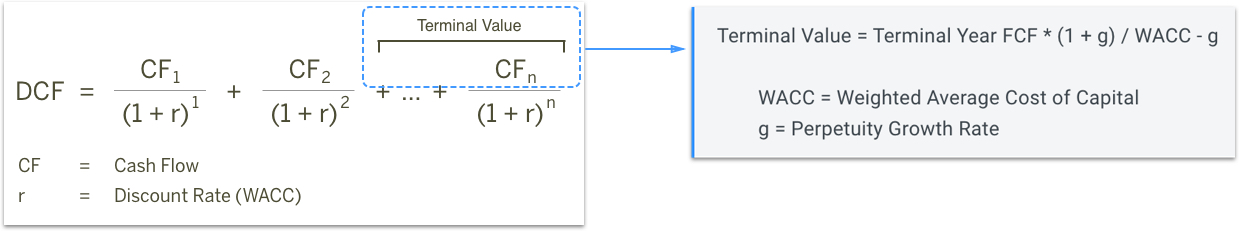
As the formula suggests, we need to estimate a “perpetuity” growth rate at which we expect Delta’s free cash flows to grow forever. Most analysts suggest that a reasonable rate is typically between the historical inflation rate of 2% to 3% and the historical GDP growth rate of 4% to 5%.
However, I selected a perpetuity growth rate of 0.25% (at the midpoint) because Delta's free cash flows are growing below these levels at the end of the projection period.
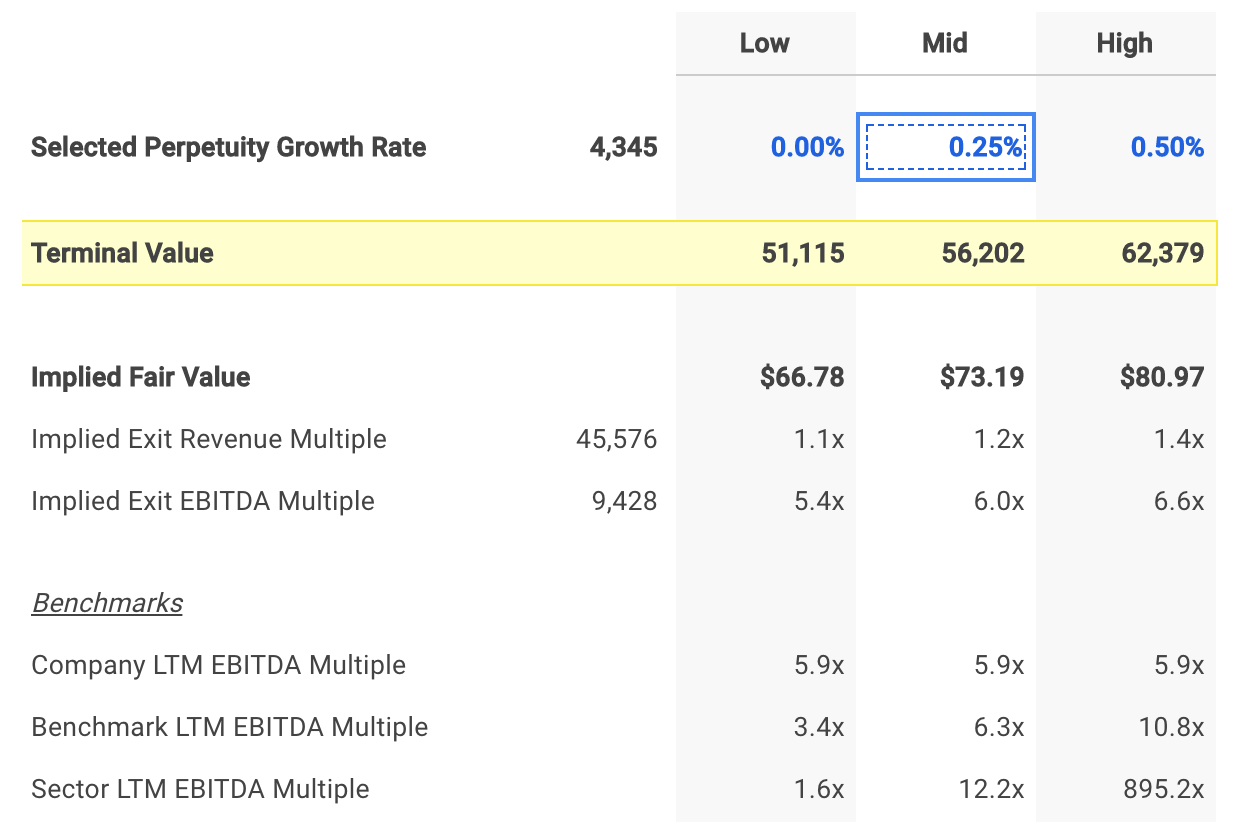
An EBITDA multiple is calculated by dividing enterprise value by EBITDA. Similarly, the terminal EBITDA multiple implied from a DCF analysis is calculated by dividing the terminal value by the terminal year’s projected EBITDA. Comparing the terminal EBITDA multiple implied from the selected growth rate to benchmark multiples can serve as a useful check.
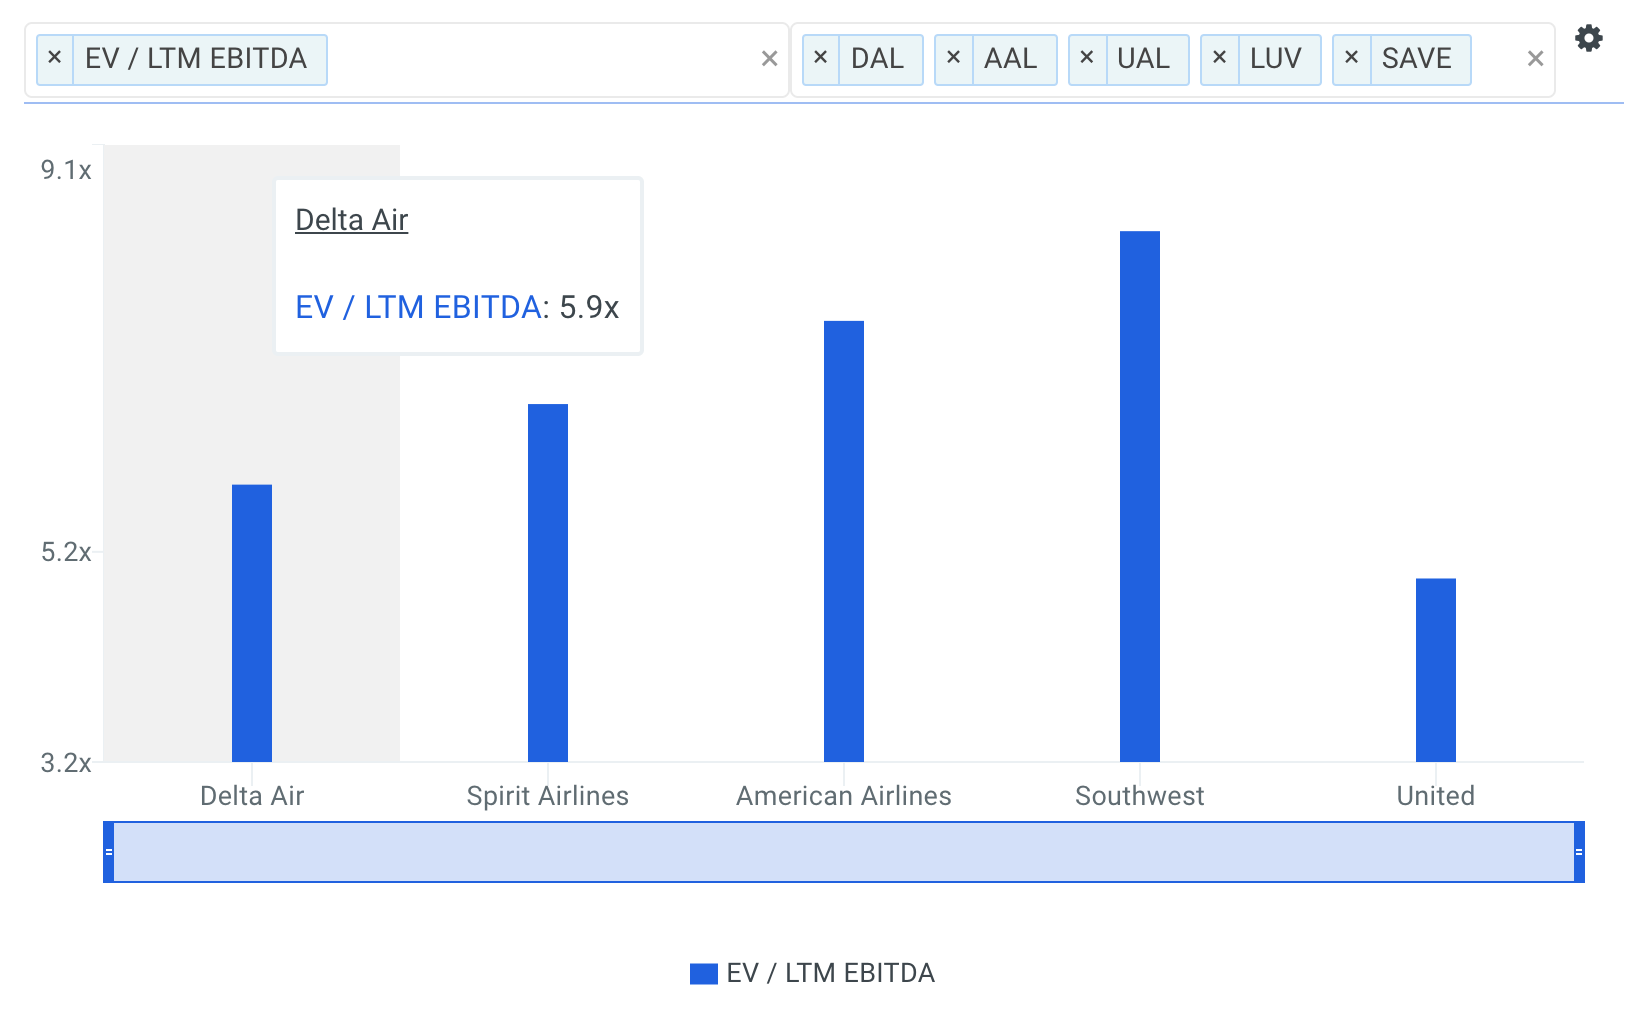
Delta's implied EBITDA multiple of 6.0x is slightly above its current EBITDA multiple of 5.9x which seems reasonable.
Step 4: Calculate Delta's Equity Value
The enterprise value previously calculated is a measure of the company’s total value. An equity waterfall is a term often used by valuation firms, referring to the trickle-down process of computing a company’s equity value from its enterprise value. Note that in the event of a bankruptcy, debt holders will be paid in full before anything is distributed to common shareholders. Therefore, we must subtract debt and other financial obligations to determine a firm’s equity value. The general formula for calculating equity value is illustrated in the figure below.
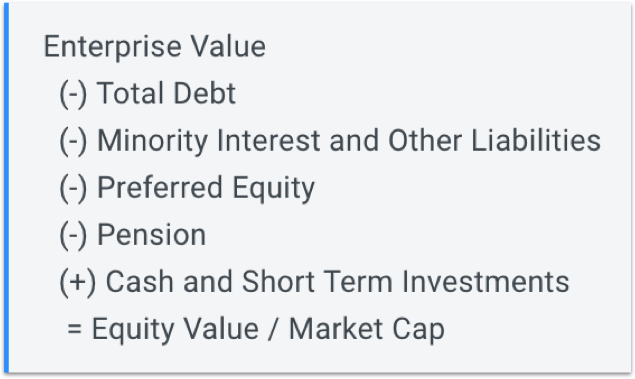
The model uses the formula shown above to calculate equity value and divides the result by the shares outstanding to compute intrinsic value per share as shown at the bottom of the figure below.
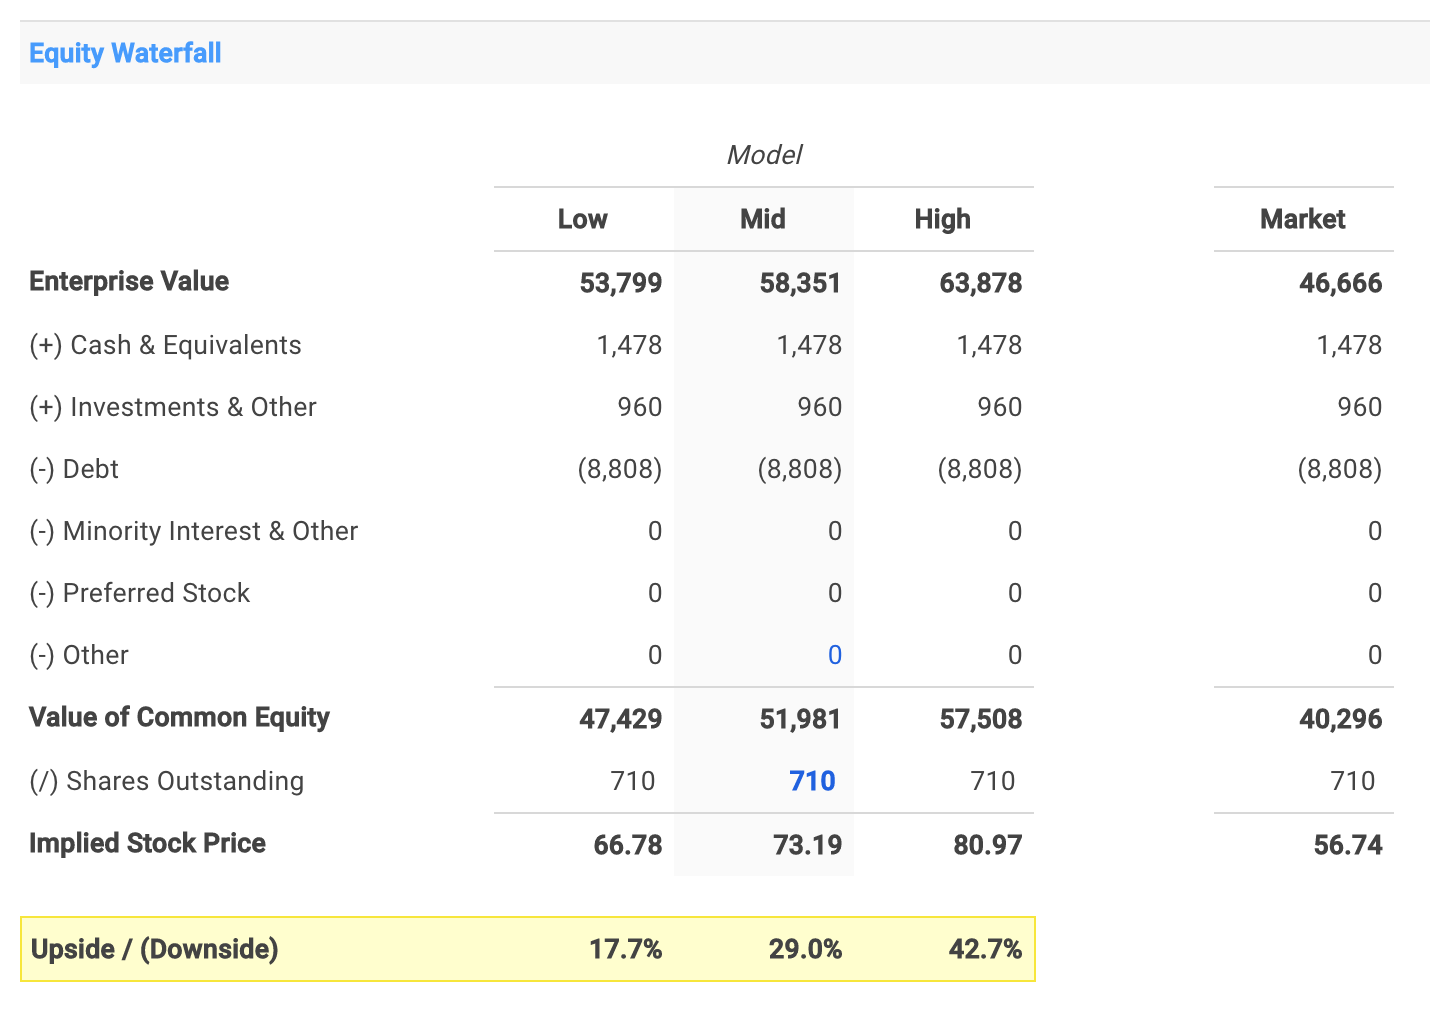
The assumptions I used in the model imply an intrinsic value per share range of $66.78 to $80.97 for Delta.
Delta's stock price last traded at $56.74 as of Tuesday, January 2nd, 29.0% below the midpoint value of $73.19 per share.
Conclusion: Delta Still Has Upside Potential
A DCF analysis can seem complex at first, but it’s worth adding to your investment analysis toolbox since it provides the clearest view of company value. I’ll end with this quote by renowned economist John Maynard Keynes:
“It is better to be roughly right than precisely wrong.”
Instead of focusing on the getting each of the assumptions exactly right, take Keynes’ advice on being roughly right. Select different assumptions deemed reasonable to get a sense for key drivers of value. Apply multiple scenarios (e.g., base case, downside case etc.) to get comfortable with the upside and downside potential of the company.

This is not a buy or sell recommendation on any security mentioned.
Author: Matt Hogan
Expertise: Valuation, financial statement analysis
Matt Hogan is a co-founder of finbox.io. His expertise is in investment decision making. Prior to finbox.io, Matt worked for an investment banking group providing fairness opinions in connection to stock acquisitions. He spent much of his time building valuation models to help clients determine an asset’s fair value. He believes that these same valuation models should be used by all investors before buying or selling a stock.
His work is frequently published at InvestorPlace, Benzinga, ValueWalk, AAII, Barron's, Seeking Alpha and investing.com.
Matt can be reached at [email protected].


