
Earnings Power Value Model
How to Build an Earnings Power Value Model
The Earnings Power Value (EPV) model is a quick way to estimate the fair value of a stock based on free cash flow. It was popularized by Professor Bruce Greenwald in the book Value Investing.
Here is how Investopedia describes the EPV model:
Earnings Power Value (EPV) is a technique for valuing stocks by making an assumption about the sustainability of current earnings and the cost of capital but assuming no further growth.
Earnings Power Value is a specific formula:
Adjusted Earnings / Cost of Capital
While the formula is simple, finding the adjusted earnings can be difficult and must consider operating earnings, taxation adjustments, depreciation and more.
As Investopedia suggests, calculating adjusted earnings is part art, part science. The models on finbox.com make it simple to estimate Adjusted Earnings and Cost of Capital breaking the process down into a series of steps:
- Step 1: Estimate an Adjusted EBIT Margin
- Step 2: Estimate a Normalized EBIT Margin
- Step 3: Estimate a Normalized Tax Rate
- Step 4: Estimate Maintenance Capital Expenditures
- Step 5: Calculate Adjusted Earnings
- Step 6: Calculate Fair Value
I've created an Illustrative EPV model for Apple that you can use to follow along with this guide:
Google Spreadsheet of Illustrative EPV Model
You can also build your own updated model on finbox.com here.
Step 1: Estimate an Adjusted EBIT Margin
Since an EPV model depends heavily on Adjusted Earnings, it's important to understand all the parts that go into it. Here is the definition of Adjusted Earnings:
Adjusted Earnings =
    Normalized EBIT
    (-) Tax Expense
    (-) Maintainence CapEx
    (+) D&A (95% of CapEx)

EBIT = Earnings before Interest & Taxes
To build up to Normalized EBIT, it's helpful to review trends in EBITDA and EBIT and first estimate Adjusted EBIT Margin.
EBITDA to Adjusted EBIT Margin
If there any unusual expenses or gains that are skewing historical earnings, it's best to exclude their impact to get a cleaner view of true earnings. I didn't see anything unusual in Apple's earnings so I used the numbers as reported.
Here is a look at the buildup:
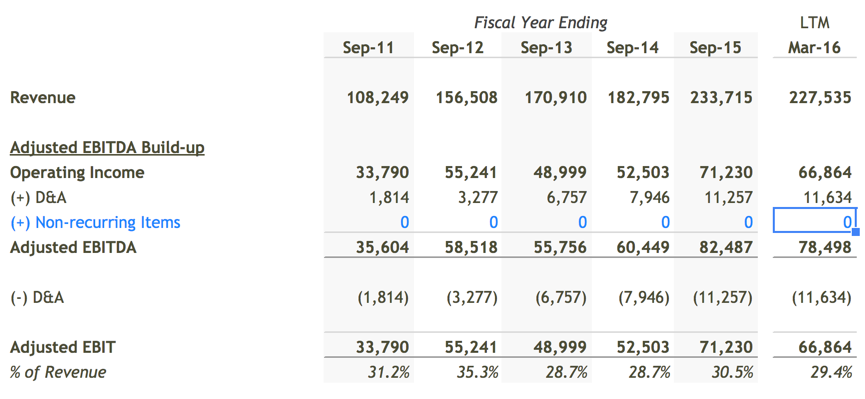
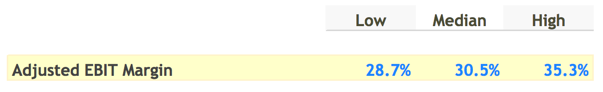
By default, finbox.com's EPV models assume the lowest Adjusted EBIT Margin the company earned in the past five years on the low end of the fair-value range and the highest it earned on the high-end. At the mid-point, the model use the median over last five years. I left these assumptions unchanged since they seemed reasonable.
Step 2: Estimate a Normalized EBIT Margin
As mentioned earlier, an EPV model assumes no future growth. Since the EBIT we selected earlier contains expenses related to growth like Research & Development, Marketing, & SG&A, let's add them back to EBIT.
Apple has historically spent an average of 9.2% of revenue on these operating expenses. I assumed that it could cut somewhere between 15% - 25% in a no growth scenario, which would translate into a 1.3% - 2.5% bump in EBIT margin.
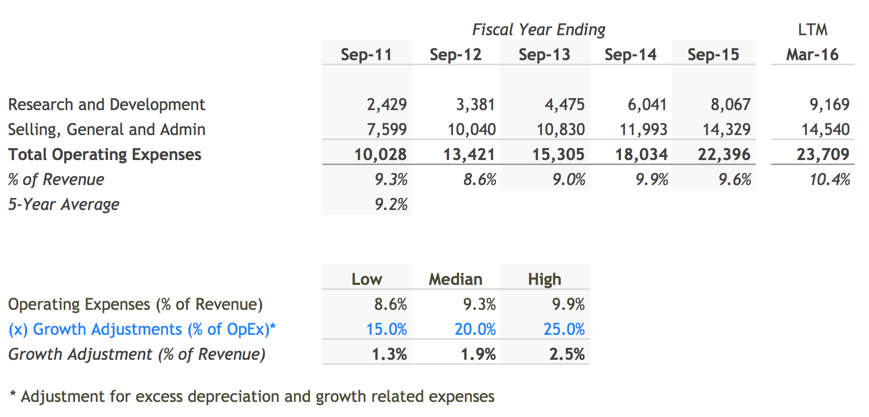
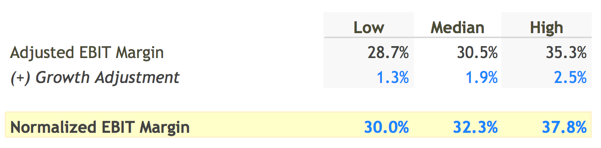
The model adds this bump to the Adjusted EBIT Margin we calculated earlier to calculate Normalized EBIT Margin. We'll use this margin assumption later to estimate a dollar amount for Normalized EBIT by multiplying it by Sustainable Revenue (Step 5).
Step 3: Estimate a Normalized Tax Rate
"In this world, nothing can be said to be certain except death and taxes."

    - Benjamin Franklin
The company will need to continue paying a portion of it's profits to the governments in the countries it operates. To estimate the portion of income the company will need to forfeit in taxes, historical effective tax rates can be useful for guidance:
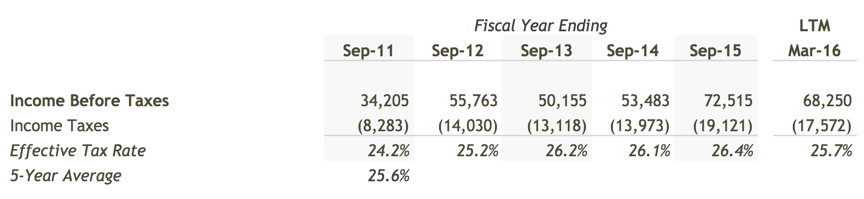
Over the last five years, Apple has paid 25.6% of it's income in GAAP taxes. This felt a little low compared to the 39.1% U.S. marginal corporate tax rate so I bumped my assumption up to 30%.

Step 4: Estimate Maintenance Capital Expenditures
As a company operates, it's machines, office space, and property start to wear down. To account for this normal wear and tear, we need to estimate how much the company will need to spend on capital expenditures (CapEx) to maintain it's current level of earnings going forward.
Since capital expenditures (CapEx) reduce company value, finbox.com's EPV models assume the lowest CapEx as a % of revenue or CapEx Margin in the past five years on the high end of the fair value range and the highest CapEx Margin over the same period on the low-end fair value range. At the mid-point, finbox.com assumes the median over the last five years.
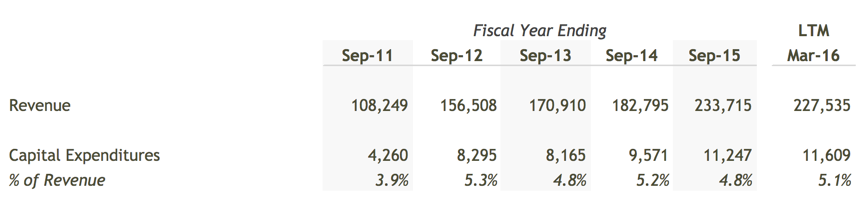
I left the default assumptions unchanged in my model:
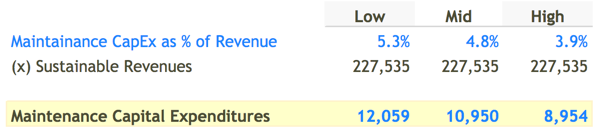
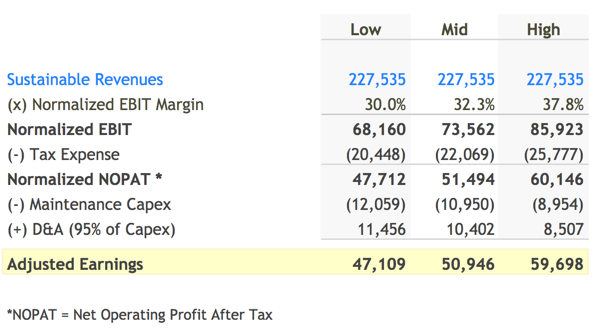
Step 5: Calculate Adjusted Earnings
Time to calculate Adjusted Earnings. Starting at the top of the Income Statement, I used last twelve months revenue (LTM Revenue) for Sustainable Revenues.
The model then applied the margin assumptions I selected in previous steps and computed the following schedule for Adjusted Earnings:
Step 6: Calculate Fair Value
We can now put it all together and calculate a Fair Value range! To estimate the value of the stream of Adjusted Earnings calculated in the last step, the model divides these earnings by the Apple's weighted average cost of capital (WACC).
finbox.com has a WACC Model that you can use to arrive at your own estimate for WACC.
I came up with an estimate of 8.5% - 10.5% for WACC using the finbox.com WACC Model. Here's the conclusion:
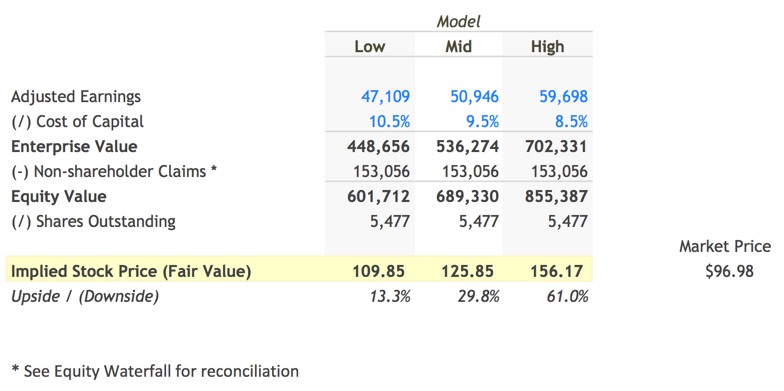
The model first applies the EPV Formula Adjusted Earnings / WACC to calculate Enterprise Value. The model then uses a standard Equity Waterfall to determine a range for Fair Value per Share.
The assumptions I used estimated Apple's fair value per share to be somewhere between $109.85 to $156.17. Since Apple is currently trading at $96.98, the conclusion suggests the market is currently undervaluing the company by 29.8% at the mid-point. Interestingly! Probably worth doing some more research.
Next Steps
The EPV model is not from a perfect predictor of fair value, no unlike any other valuation model. However, the technique is really useful for quickly getting a sense of the risk of investing in a company at the current price. With a few assumptions, you can quickly determine if a company justifies further research. As with all models on finbox.com we recommend using a combination of models to get a sense of the risks involved and triangulate a fair value. finbox.com's Price Target and Alerts features are great for tracking price movements once you've come up with your fair value!


%20Model)