
Dividend Discount Model: Stable Growth
How to Build a Stable Growth Dividend Discount Model
The Dividend Discount Model (DDM) is a simple and conservative method of determining the fair value of a stock. Dividend discount models estimate the value of a company's stock price by calculating the sum of the present value of future dividend payments. There are two variations of the DDM on finbox.io, Stable Growth and Multi-Stage. This guide covers the key steps and assumptions used in the Stable Growth variation, also known as a Single Period DDM.
A Stable Growth DDM estimates an adjusted dividend and applies the Gordon Growth Formula to estimate the value of a stock.
Here is the formula of DDM:

Source: Investopedia Definition
As equation above suggests, we'll need estimates for Dividend Per Share, Cost of Equity, and growth rate to apply the formula. Here is an outline of the process we'll use select our assumptions and build a DDM:
- Step 1: Estimate Excess Retained and Adjusted Dividend
- Step 2: Estimate a Perpetuity Growth Rate
- Step 3: Calculate Fair Value
To make it easy to follow along with this guide, I've created an Illustrative Dividend Discount Model for Johnson & Johnson that you can use to follow along:
Google Spreadsheet of Illustrative DDM: Stable Growth Model
You can also build your own updated model on finbox.io here.
Step 1: Estimate Excess Retained and Adjusted Dividend
Management is highly incentivized to manage earnings and grow revenue, earnings and dividends at stead intervals each quarter. Much has been studied and written on this topic.
Since the Dividend Discount Model assumes all available earnings are paid out as dividends, we can get a better estimate of fair value by adding a portion of net income that management could have paid out to the Current Dividend. This is easier than projecting when the excess cash that gets built on the balance sheet will be returned to shareholders. In practice, the excess retained cash is usually paid out to shareholders in the form of special dividends or used to make up for cash shortfalls for dividends during economic downturns. You can choose to skip this adjustment, but beware that you'll likely end up with an estimate well below market value for most companies. Here is the general process of estimating Excess Retained:
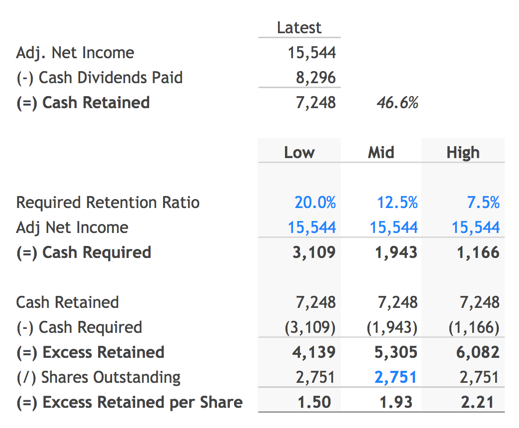
In the Illustrative Johnson & Johnson model, we can see that the company earned $15.544 billion in Net Income over the last twelve months, paid out $8.296 billion in cash dividends, and "retained" $7.248 billion. This implies a retention ratio of 46.6%.
In a stable growth scenario, it would be fair to assume the company would only need to retain between 7.5% to 20% of Net Income. This amounts to the Excess Cash Retained per Share of $1.50 - $2.21 show above.
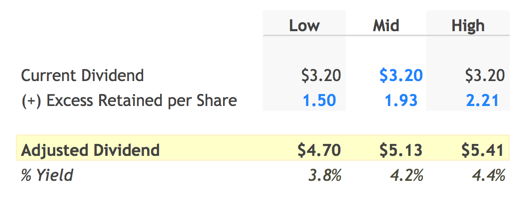
If we add this Excess Retained Cash to the annualized Current Dividend of $3.20 ($0.80 last quarter * 4) we can arrive at our estimate of Adjusted Dividend - $4.70 - $5.41, with a mid-point of $5.13 per share.
Step 2: Estimate a Perpetuity Growth Rate
Next, we need to estimate a Perpetuity Growth Rate. Here is some sound guidance on selecting a perpetuity growth rate from Macabacus
The perpetuity growth rate is typically between the historical
inflation rate of 2-3% and the historical GDP growth rate of 4-5%.
If you assume a perpetuity growth rate in excess of 5%, you are
basically saying that you expect the company's growth to outpace the
economy's growth forever.
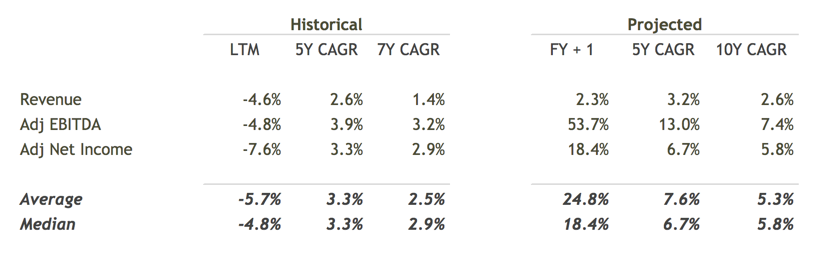
Reviewing the JNJ's historical and projected 5 year compound annual growth rates (CAGRs) can be useful in determining if we should bias the selection towards the higher or lower end of the range.
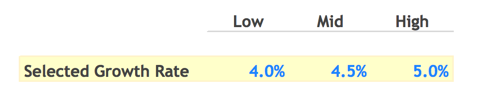
Based on the historical and projected data, I've selected a range
of 4% - 5% given the strong future outlook.
Step 3: Calculate Fair Value
The last assumption we need to calculate a Fair Value is Cost of Equity. finbox.io has a Cost of Capital model that you can use to estimate Cost of Equity.
Using the Cost of Capital model, I've estimated the Cost of Equity for JNJ to be in the range of 9% to 10%.
Now the fun part! We can take our estimates for Adjusted Dividend, Perpetuity Growth Rate and Cost of Equity and input them in the Gordon Growth Formula discussed earlier calculated Fair Value:
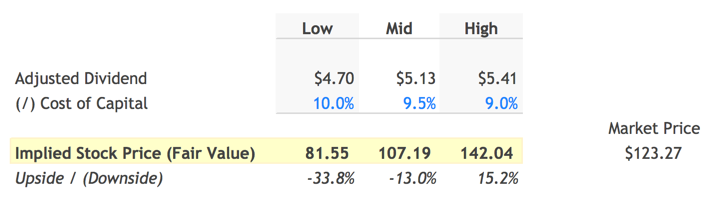
Based on my assumptions, Johnson and Johnson's Fair Value per Share is somewhere between $81.55 to $142.04. Since the stock is currently trading at $123.27, the mid-point of my model suggests the market is currently overvaluing JNJ by 13%.
Next Steps
Dividend discount models can be useful in quickly evaluating the impact of different assumptions about growth and future prospects. With a few assumptions, you can determine if a company justifies further research. As with all models on finbox.io we recommend using a combination of models to get a sense of the risks involved and triangulate a fair value.

