Dividend Discount Model: Multi-Stage
How to Build a Multi-Stage Dividend Discount Model
The Dividend Discount Model (DDM) estimates the value of a company's stock price based on the theory that its worth is equal to the sum of the present value all of its future dividend payments to shareholders. There are two variations of the DDM on finbox.io, Stable Growth and Multi-Period. This guide covers the key steps and assumptions used in the Multi-Stage variation, also knowns as Multi-Period DDM.
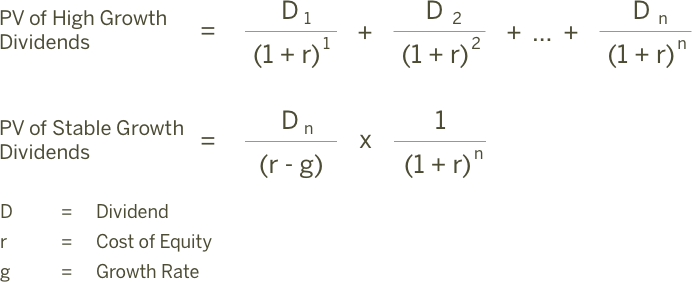
The Multi-Stage model assumes the subject company will experience differing growth phases. This provides greater control over the near-term dividends which are the most valuable. After the discrete projection period of five years, we can use the standard Gordon Growth Formula to estimate Terminal Value. The methodology behind the DDM can be summarized with the following two formulas:
Source: AccountingExplained
As equations above suggests, we'll need estimates for Growth Period Dividends, present value of stable growth dividends or Terminal Dividend, Cost of Equity, and growth rate.
Here is an outline of the process:
- Step 1: Forecast Net Income
- Step 2: Forecast Adjusted Dividends
- Step 3: Estimate a Perpetuity Growth Rate
- Step 4: Calculate Fair Value
I've created an Illustrative DDM: Multi-Stage model for MasterCard that you can use to follow along:
Google Spreadsheet of Illustrative DDM: Multi-Stage Model
You can also build your own updated model on finbox.io here.
Step 1: Forecast Net Income
Forecasting dividends directly can be difficult. Making reasonable estimates for Net Income based on historical margins and growth is usually significantly easier. So let's create a net income forecast for the next five years and use the forecast as the basis for future adjusted dividends.
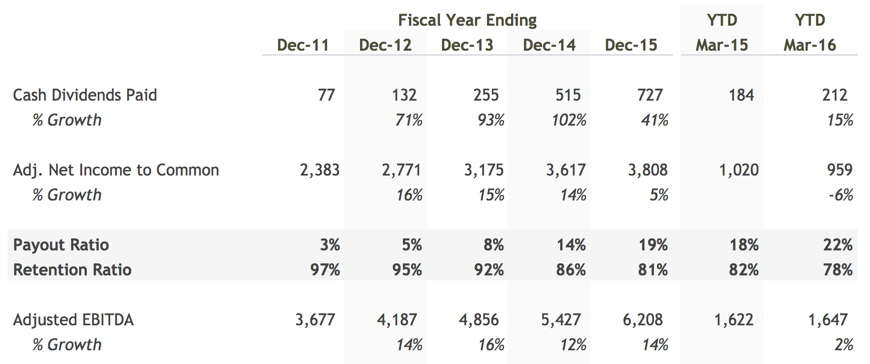
At the time of this writing, analyst's are projecting robust EPS growth over the next three years $3.55 (+2.5%), $4.14 (+16.6%), and $4.80 (+15.9%). That feels a bit too optimistic to me given historical performance:
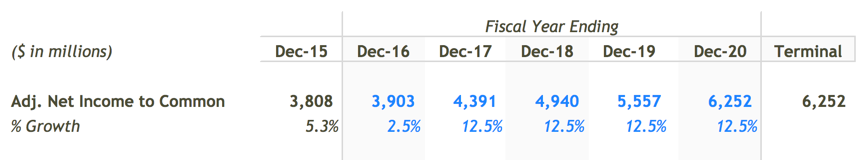
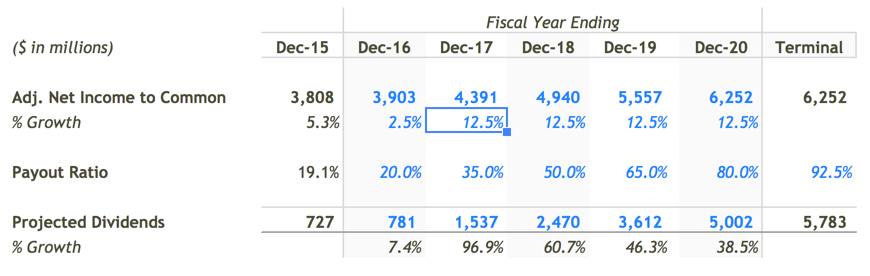
In my model, I modified the default forecast to assume 12.5% growth in Net Income for fiscal years ending December 2017 through December 2020.
Step 2: Forecast Adjusted Dividends
We can use the Net Income forecast to serve as the basis for the dividend forecast. In my forecast, I assumed a steady increase in payout ratio. Management is highly incentivized to manage earnings and deliver steady quarterly growth in revenue, earnings, and dividends so it is unlikely they will be as aggresive. Much has been studied and written on this topic. Steadily increasing the payout ratio assumption however allows me to capture value that would otherwise build up as cash on the balance sheet. In practice, this excess retained cash is usually paid out to shareholders as special dividends or to make up for cash shortfalls for dividends during economic downturns.
Here's my final Adjusted Dividends forecast:
Step 3: Estimate a Perpetuity Growth Rate
Next, we need to estimate a Perpetuity Growth Rate. Here is some sound guidance on selecting a perpetuity growth rate from Macabacus:
The perpetuity growth rate is typically between the historical
inflation rate of 2-3% and the historical GDP growth rate of 4-5%.
If you assume a perpetuity growth rate in excess of 5%, you are
basically saying that you expect the company's growth to outpace the
economy's growth forever.
MasterCard's historical and projected compound annual growth rates (CAGRs) are great data points for guiding selection of a perpetuity growth rate.
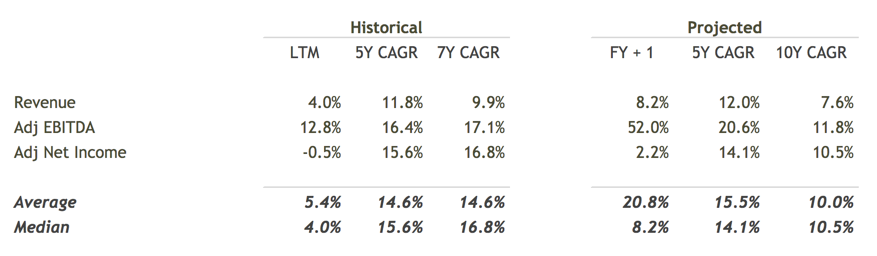
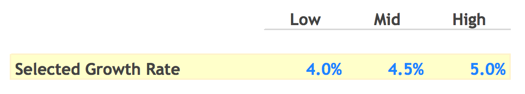
I selected a range between 4.0% to 5.0% given the strong historical and future outlook for MasterCard.
Step 4: Calculate Fair Value
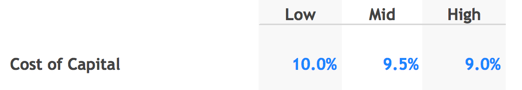
The last assumption we need to calculate a Fair Value is Cost of Equity. finbox.io has a Cost of Capital that's great for estimating Cost of Equity.
Time to put it all together! First order of business is discounting the individually forecasted dividends back to present value. finbox.io's models do the heavily lifting of calculating the Discount Factors using the mid-year convention. You can follow the methodology used to estimate present value by reviewing the a) Discounting Periods, b) Discounting Factors c) PV of Discrete Dividends sections in the model.
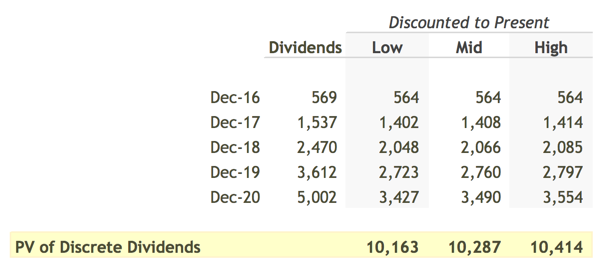
Using these Discount Factors the model arrives at an estimate for the present value of the forecasted dividends of $10.1 to $10.4 billion.
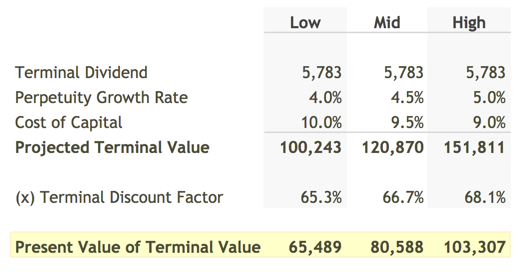
Next we need to estimate the value after the forecast period or Terminal Value. As discussed earlier, this model uses the Gordon Growth formula to estimate Terminal Value in the future and then uses the Terminal Discount Factor to determine it's value today.
Here is the calculation of Present Value of Terminal Dividends:
The model then adds the two present values to calculate MasterCard's Total Equity Value. You can compare Total Equity Value to MasterCard's Market Cap.. To get to a per share Fair Value that we can compare to the current stock price, the model divides Total Equity Value by the current shares outstanding.
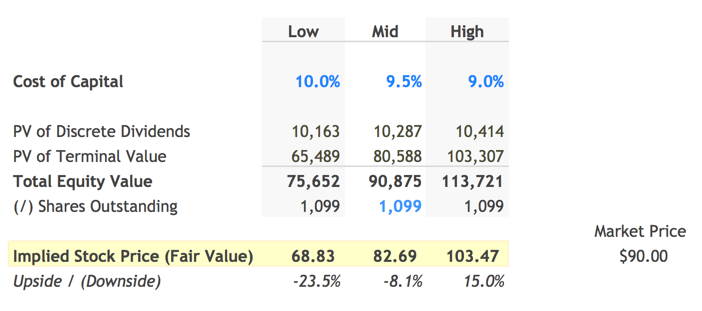
The assumptions I used in my model calculated yield a Fair Value per Share for MasterCard of $82.69, 8% below it's current stock price of $90.00. This isn't surprising since Dividend Discount Models are known to provide conservative estimates of Fair Value. Nevertheless, I prefer to invest in stocks that offer at least a 15% discount price estimates derived using DDMs. Luckily, finbox.io's Price Target and Alerts features are great for tracking keeping an eye out for pull-backs in stock price!
Next Steps
Dividend discount models can be useful in quickly evaluating the impact of different assumptions about growth and future prospects. With a few assumptions, you can determine if a company justifies further research. As with all models on finbox.io we recommend using a combination of models to get a sense of the risks involved and triangulate a fair value.
Sources / Further Reading:
- Multi-stage Dividend Discount Model
- Digging Into The Dividend Discount Model
- Damodaran Chapter 13: Dividend Discount Models
- Study finds executives who manage earnings more likely to be hired, promoted
- Compound Annual Growth Rate
- WACC Model
- Video on Discount Factors and NPV
- Mid Year Convention
- Gordon Growth Formula

