David Dreman, founder and Chairman of Dreman Value Management, is best known for his contrarian value investing strategy. His published research has proven that out of favor stocks significantly outperform stocks considered to have more favorable outlooks.
In a 2015 Forbes interview, Dreman explained that stocks with
“Low PE (multiples) have always outperformed the market enormously over 10, 15 and 20 years. For example, we did a 35-year study where if an institutional investor had $1 million, he’d have about $250 million at the end of those 35 years. This is against half of that for the S&P and much less for higher PE stocks.”
To learn more about his investment philosophy, view this resource page.
I used the finbox.io stock screener to find stocks included in the Russell 1000 index that may be considered out of favor. The specific screen criteria:
- PE multiple < 14.0x (represents the bottom 20% of Russell 1000 companies)
- Free cash flow yield > 8% (represents the bottom 20% of Russell 1000 companies)
- Trailing twelve month earnings growth > 0%
- Stock price is currently trading at less than 120% of its 52 week low (another helpful out of favor indicator)
Only 10 stocks fit the above criteria.
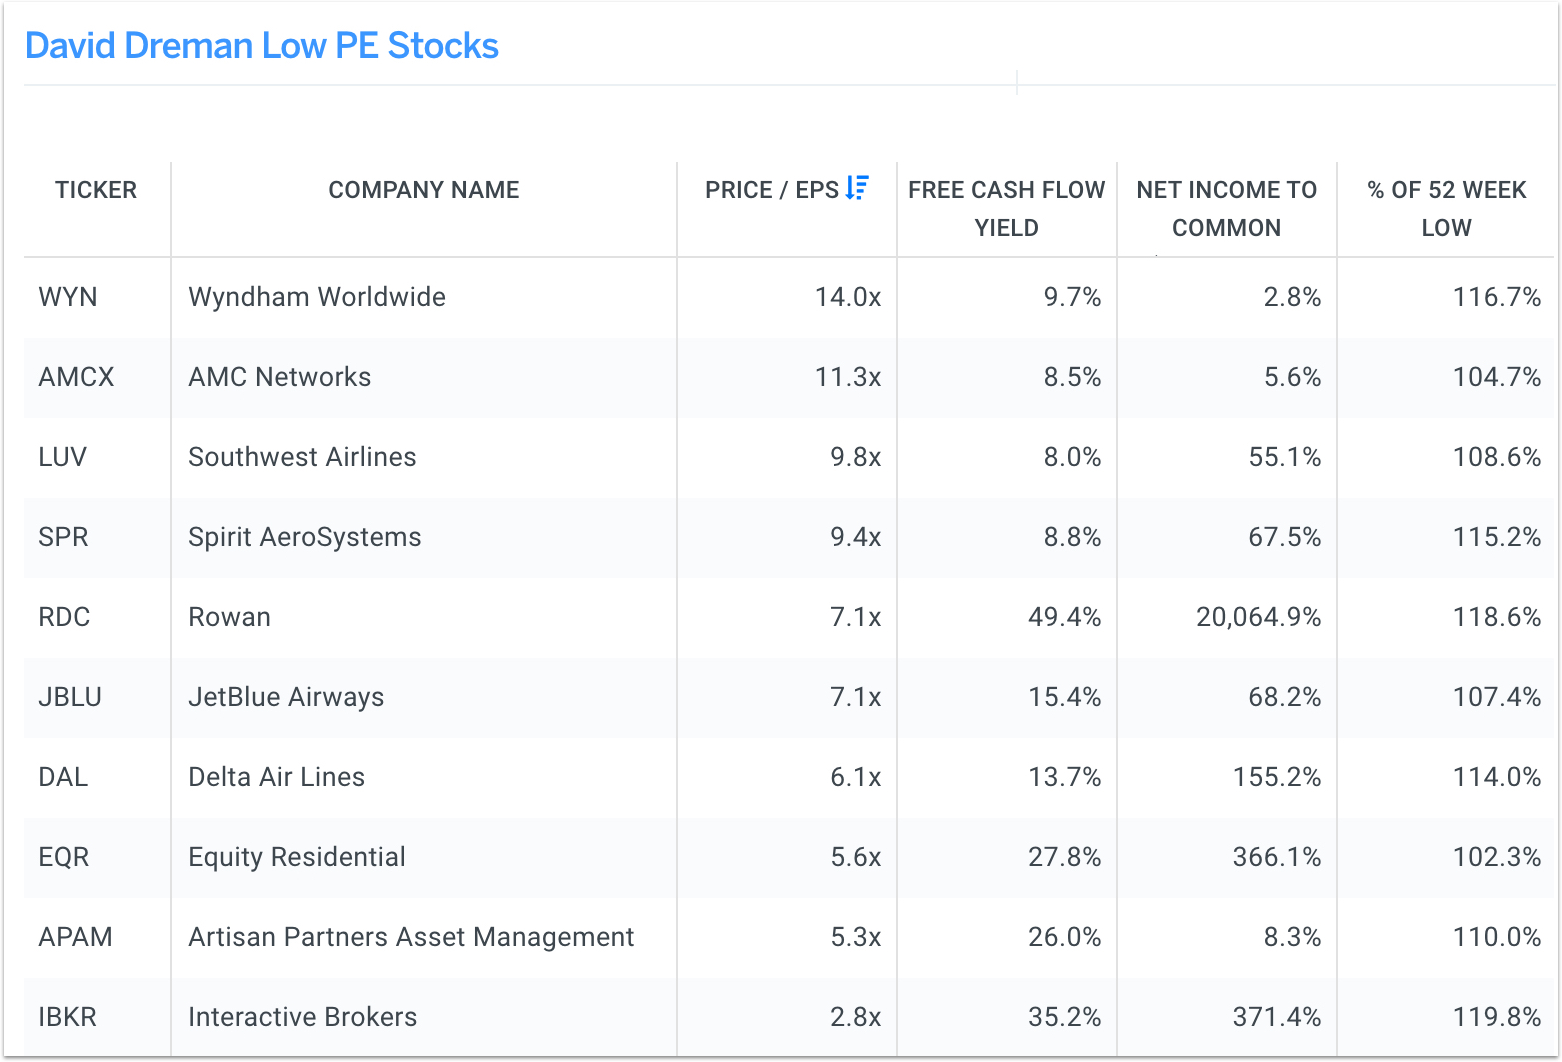
10 Out of Favor Stocks
<img src='http://res.cloudinary.com/finbox/image/upload/v1473259134/Results_Summary_z6ourp.jpg' alt= ‘David Dreman Screen Results’>
View the latest screen results here
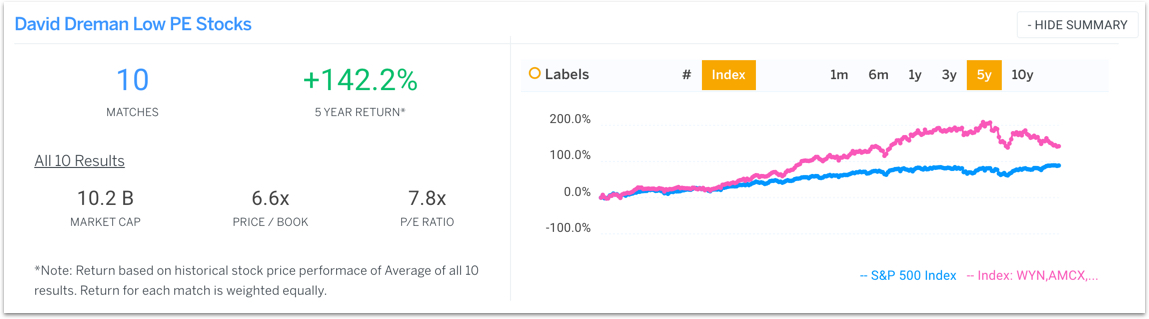
Here are the summary stats of the screen results.
<img src='http://res.cloudinary.com/finbox/image/upload/v1473259126/5Year_Returns_akpau0.jpg' alt= ‘David Dreman Screen 5year Returns’>
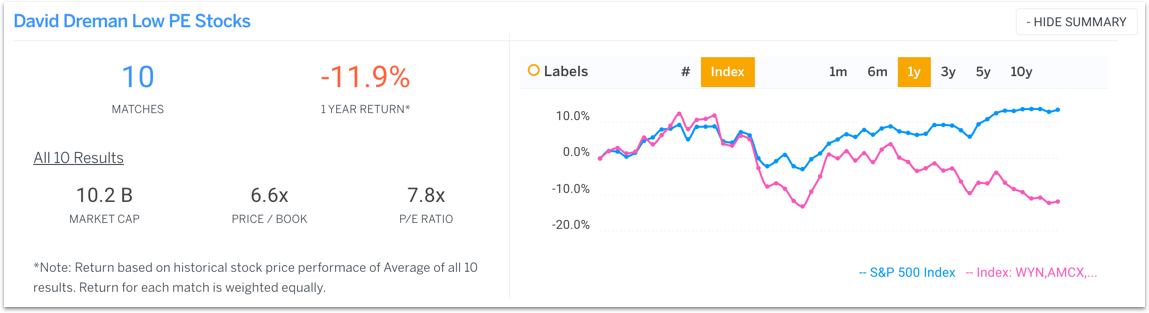
Note that the five-year return for this ten company index (142%) significantly outperformed the S&P 500 (88.9%) over the same period. However, notice below how this same ten company index significantly underperformed the S&P 500 over the last year.
<img src='http://res.cloudinary.com/finbox/image/upload/v1473259124/1Year_Returns_sywppp.jpg' alt= ‘David Dreman Screen 1year Returns’>
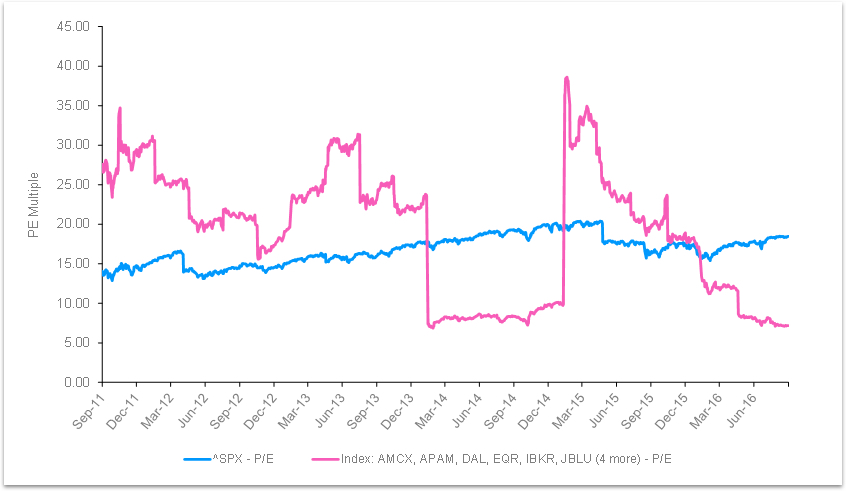
The chart below highlights the trailing twelve month PE multiples over the last 5 years for the ten company index vs the S&P 500 (all equally weighted).
<img src='http://res.cloudinary.com/finbox/image/upload/v1473259128/Historical_PE_Multiples_qvcm30.jpg' alt= ‘David Dreman Screen PE Multiples’>
Source: CapitalIQ
Notice how the current 7.8x PE multiple for the ten company index is significantly below its five year average of approximately 20.0x.
Applying David Dreman’s contrarian strategy, value investors may want to take a closer look at the following out of favor stocks:
- AMC Networks (AMCX)
- Artisan Partners Asset Management (APAM)
- Delta Air Lines (DAL)
- Equity Residential (EQR)
- Interactive Brokers (IBKR)
- JetBlue Airways (JBLU)
- Rowan (RDC)
- Southwest Airlines (LUV)
- Spirit AeroSystems (SPR)
- Wyndham Worldwide (WYN)
Get Started Now!
Article written by Matt Hogan.
Investors are always reminded that before making any investment, you should do your own proper due diligence on any name directly or indirectly mentioned in this article.

