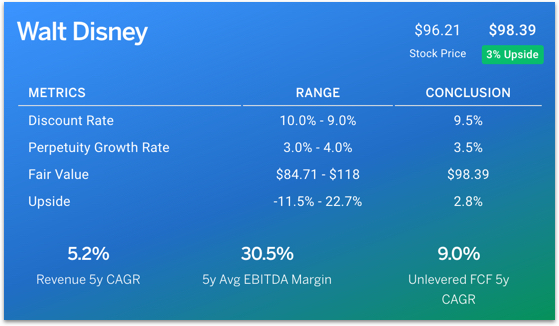
This article will calculate Walt Disney’s (DIS) intrinsic value by using finbox.io’s 5-year discounted cash flow (DCF) analysis. Summary:
- Forecast Free Cash Flows
- Select a Discount Rate
- Calculate a Terminal Value
The conclusion illustrates that the company is currently trading slightly below its fair value.
<img src='http://res.cloudinary.com/finbox/image/upload/v1470760131/DIS_Valuation_Model_Summary_mbvkph.jpg' alt= ‘DIS DCF Valuation Conclusions’>
Forecast Free Cash Flows
Forecast Revenue
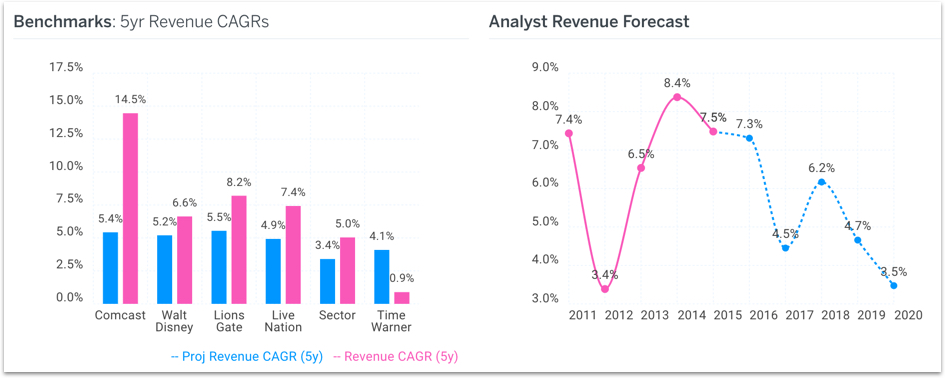
Finbox.io uses analyst forecasts for Revenue as the starting assumptions in a model. I typically review the analyst forecast and modify the growth rates based on historical performance, news, and other insights.
The projected revenue forecast for Disney (shown below) seems reasonable based on historical growth rates as well as when comparing to similar companies Comcast (CMCSA), Lions Gate (LGF), Live Nation (LYV) and Time Warner (TWX).
<img src='http://res.cloudinary.com/finbox/image/upload/v1470760133/Revenue_forecast_idxqwl.jpg' alt= ‘DIS Revenue Forecast’>
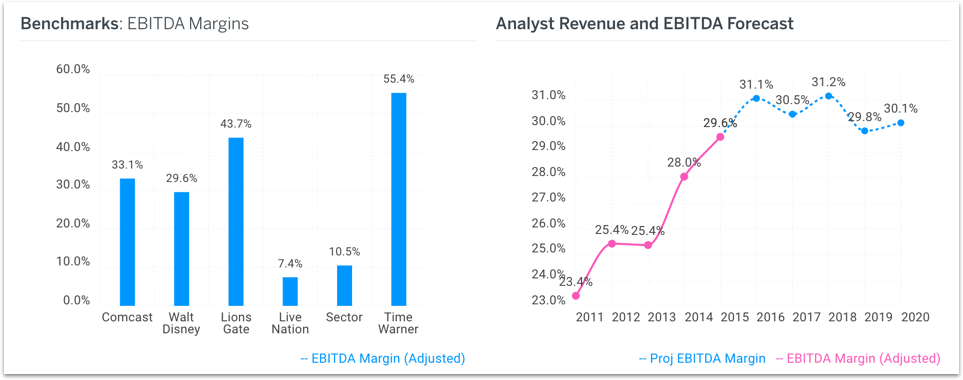
Forecast EBITDA Profit Margin
How much of the revenue Disney generates will the company convert into profit? The analyst projected EBITDA margin forecast for Disney below also looks reasonable. In fact, it could prove to be a very conservative forecast as margins have been improving over the last few years. However, I will use these conservative numbers in my assumptions.
<img src='http://res.cloudinary.com/finbox/image/upload/v1470760133/EBITDA_Margin_Forecast_hp2cp9.jpg' alt= ‘DIS EBITDA Forecast’>
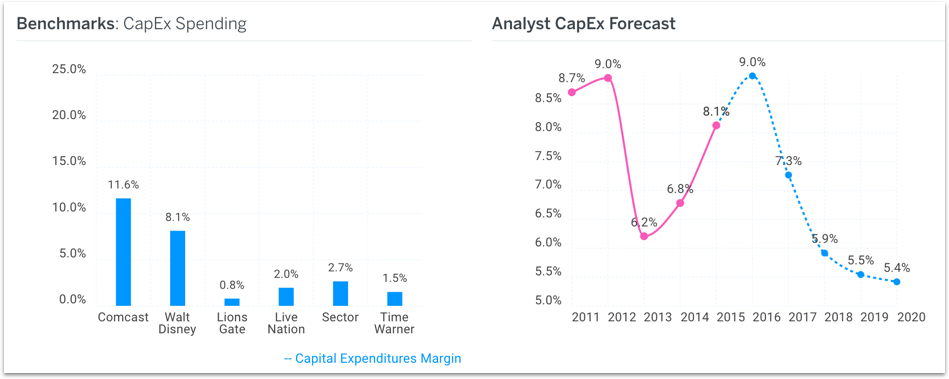
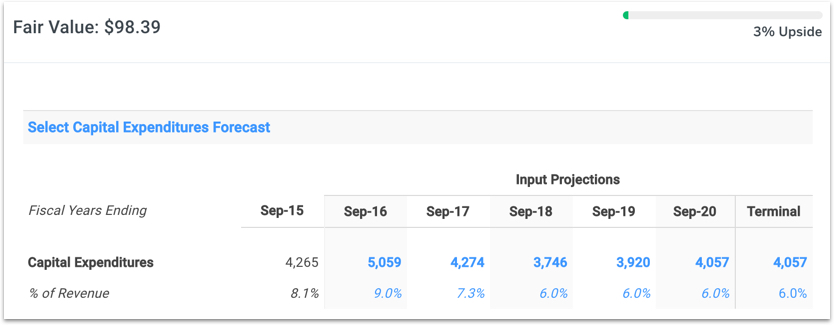
Plan Capital Expenditures
Spending on plant, property, and equipment allow the company to operate and grow. Disney has spent anywhere from 6.2% to 9.0% of revenue in the last five years on capital expenditures. In the chart below, you can see analysts expect this figure to drop to 5.8% by 2018.
<img src='http://res.cloudinary.com/finbox/image/upload/v1470760129/Capex_Forecast_qzbf9y.jpg' alt= ‘DIS Capex Forecast’>
I prefer being conservative in my DCF analysis so I assume capex margins remain flat at 6.0% starting in 2018.
<img src='http://res.cloudinary.com/finbox/image/upload/v1470760128/Capex_Assumptions_ht6qoh.jpg' alt= ‘DIS Capex Margin Assumptions’>
Note: this capex adjustment brings Disney’s fair value midpoint conclusion down from $100.79 to $98.39.
I don’t explicitly show the calculated free cash flows that result from my assumptions above. You can view them in my model here.
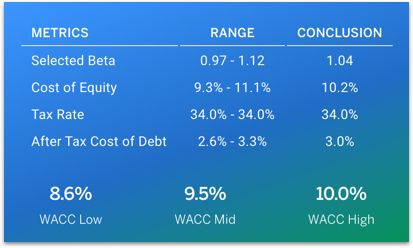
Select a Discount Rate
Next, I need a discount rate or Weighted Average Cost of Capital (WACC) to calculate the present value of my forecasted free cash flows above. I determined a reasonable WACC estimate for Disney to be 9.5% at the midpoint. You can view my calculations here.
<img src='http://res.cloudinary.com/finbox/image/upload/v1470760128/DIS_WACC_hx80ov.jpg' alt= ‘DIS WACC Conclusion’>
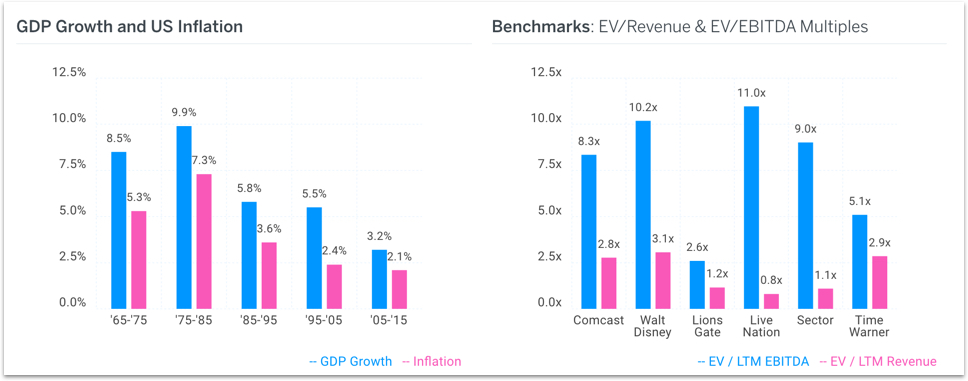
Calculate a Terminal Value
Disney will still be valuable at the end of the 5 year forecast period. To estimate this future value (Terminal Value), we can capitalize it's terminal cash flow using the Gordon Growth formula. Here is data provided by finbox.io to help make my perpetuity growth rate assumption:
<img src='http://res.cloudinary.com/finbox/image/upload/v1470760134/Terminal_Value_Support_qqgmp7.jpg' alt= ‘DIS Terminal Value Support’>
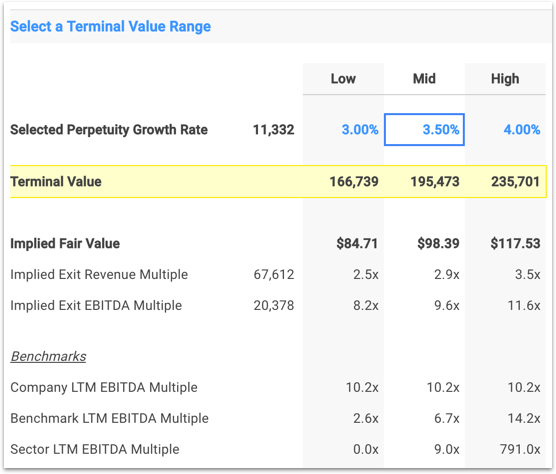
The perpetuity growth rate is typically between the historical inflation rate and the historical GDP growth rate. If you assume a perpetuity growth rate in excess of 5%, you are basically saying that you expect the company's growth to outpace the economy's growth forever. I’ve selected a terminal growth rate of 3.5% as shown below.
<img src='http://res.cloudinary.com/finbox/image/upload/v1470760135/Terminal_Value_Assumption_c1ij1x.jpg' alt= ‘DIS Terminal Value Selection’>
This selection may seem aggressive but the implied EBITDA exit multiple of 9.6x is slightly below Disney’s current trading multiple and slightly above the sector median multiple. Therefore, I'm comfortable with 3.5%.
The selected assumptions above show that Disney's intrinsic value is $98.39 per share - currently undervalued by 3%.
You can view my full DCF analysis here. You can also easily build your own using finbox.io’s quick 6-step DCF model builder for Disney here.
Get Started Now!
This article was written by Matt Hogan.

