
A new Form 4 filing with the SEC on Monday revealed that Goldman Sachs Group virtually sold its entire $1.1 billion stake in TransUnion (NYSE: TRU). Analyzing the company's fundamentals help explain why Goldman sold its shares.
Goldman Exits TransUnion
On February 14th, Goldman Sachs Group filed its quarterly 13F regulatory filing. The filing showed that the investment firm held 19,855,632 shares of TransUnion worth $1.1 billion as of December 31st. Note that this represented only 0.26% of Goldman's massive $418 billion portfolio.
However, a new filing yesterday revealed that the investment firm sold 19,852,972 shares on March 8th at an average price of $57.60 per share. This reduced Goldman's position in the company to virtually 0%. Goldman, along with buyout shop Advent International, had originally bought TransUnion for $3 billion in 2012.
TransUnion's shares last traded at $58.02 as of Monday's close, up 54.3% over the prior year. While shares have significantly appreciated in value, could the recent insider selling activity signal the stock is overvalued?
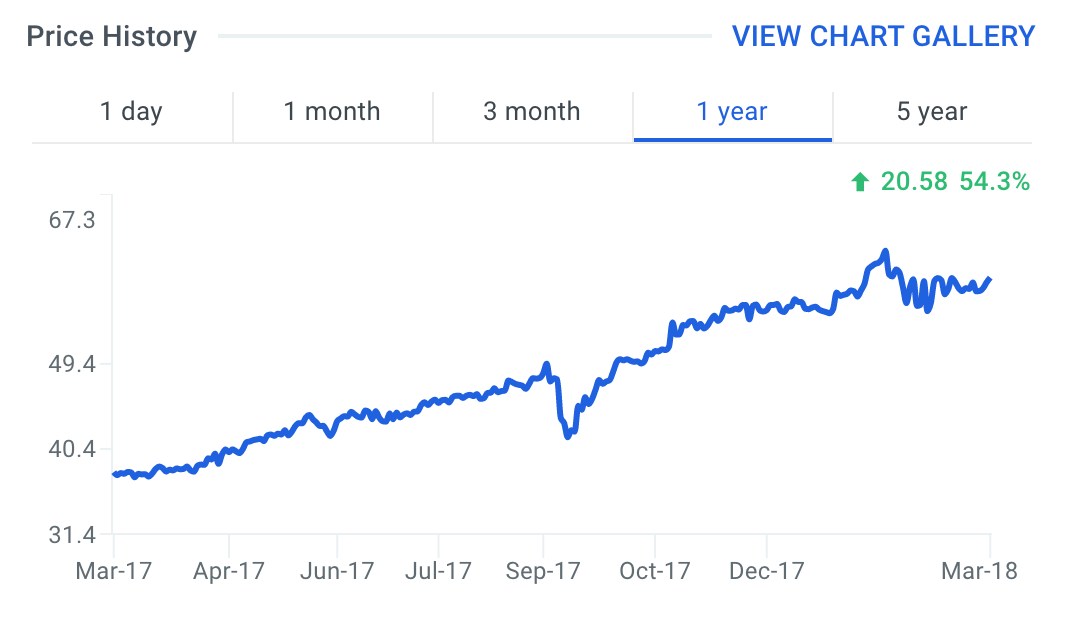
source: finbox.io
Potential Reasons For Selling Shares
TransUnion provides a variety of risk and information solutions such as consumer credit reports, credit monitoring, fraud protection and risk scores. Analysts covering the stock often compare the company to a peer group that includes Equifax (NYSE: EFX), Dun & Bradstreet (NYSE: DNB), MSCI (NYSE: MSCI) and Moody's (NYSE: MCO). Analyzing TransUnion's growth metrics and valuation multiples relative to these peers offers insight into why Goldman sold its stake.
Projected 5-year net income CAGR is the average annual growth rate of net income over a five year period. It's calculated as follows:
5yr CAGR = [ Net Income FY+5 / Net Income FY ] ^ (1/5 years) - 1
The chart below plots the five-year Net Income compounded annual growth rates for TransUnion and its peers.

source: finbox.io
The company's projected 5-year net income CAGR of 5.5% is below all of its selected comparable public companies: EFX (8.9%), DNB (21.6%), MSCI (20.5%) and MCO (15.2%). Similarly, TransUnion's projected 5-year EBITDA CAGR is below the majority of its peers.
Companies that are expected to grow at a slower rate than its peers typically trade at discounted or lower valuation multiples relative to this same peer group. However, this is not the case for TransUnion's stock as illustrated in the chart below.

source: finbox.io
The company's forward P/E multiple of 24.5x is only below MSCI (27.8x) and above EFX (20.9x), DNB (15.8x) and MCO (21.5x). Similarly, TransUnion's forward EBITDA multiple of 15.8x also trades above the majority of the comparable public companies.
In addition, finbox.io's average fair value estimate of $42.87 implies -26.1% downside and is calculated from 9 valuation models as shown in the table below. Each analysis uses consensus Wall Street estimates for the projections when available.
| Analysis | Model Fair Value | Upside (Downside) |
|---|---|---|
| 10-yr DCF Revenue Exit | $37.97 | -34.5% |
| 5-yr DCF Revenue Exit | $34.68 | -40.2% |
| Peer Revenue Multiples | $40.83 | -29.6% |
| 10-yr DCF EBITDA Exit | $48.48 | -16.4% |
| 5-yr DCF EBITDA Exit | $54.42 | -6.2% |
| Peer EBITDA Multiples | $48.77 | -15.9% |
| 10-yr DCF Growth Exit | $31.88 | -45.1% |
| 5-yr DCF Growth Exit | $30.74 | -47.0% |
| Peer P/E Multiples | $58.08 | 0.1% |
| Average | $42.87 | -26.1% |
| Median | $40.83 | -29.6% |
TransUnion shares are trading significantly higher over the last year and the stock now appears to be trading at a premium to its intrinsic value. This could be a major reason why Goldman exited its stake in the company.
It is important to note that investors should never blindly copy the trading activity of highly regarded money managers such as Goldman Sachs. However, keeping an eye on their buying and selling activity will help in making a more informed decision.
Here are a few additional items that investors should consider before drawing a conclusion:
Valuation Metrics: what is TransUnion's EBITDA less CapEx multiple and how does it compare to its peers? This is a helpful multiple to analyze when comparing capital intensive businesses. View the company's EBITDA less CapEx multiple here.
Risk Metrics: what is TransUnion's asset efficiency? This ratio measures the amount of cash flow that a company generates from its assets. View the company's asset efficiency here.
Forecast Metrics: what is TransUnion's projected EBITDA margin? Is the company expected to improve its profitability going forward? Analyze the company's projected EBITDA margin here.
Author: Brian Dentino
Expertise: financial technology, analyzing market trends
Brian is a founder at finbox.io, where he's focused on building tools that make it faster and easier for investors to research stock fundamentals. Brian's background is in physics & computer science and previously worked as a software engineer at GE Healthcare. He enjoys applying his expertise in technology to help find market trends that impact investors.
Brian can be reached at [email protected].
As of this writing, Brian did not hold a position in any of the aforementioned securities and this is not a buy or sell recommendation on any security mentioned.


)