Weighted Average Cost of Capital: CAPM
How to Build a WACC Model
Weighted Average Cost of Capital (WACC), also referred to as a firm's
cost of capital is a weighted average of the returns expected by a
firm's various capital providers.
Wikipedia defines it as follows:
Companies raise money from a number of sources: common stock, preferred stock,
straight debt, convertible debt, exchangeable debt, warrants, options, pension
liabilities, executive stock options, governmental subsidies, and so on. Different
securities, which represent different sources of finance, are expected to
generate different returns. The WACC is calculated taking into account the
relative weights of each component of the capital structure.
In short, a company's assets are financed by either debt or equity.
WACC is the average of these sources of financing, each weighted
by respective usage.
The formula to calculate weighted average cost
of capital is the following:
  Total Capital = Debt + Equity

  WACC =
      (Equity / Total Capital) * CoE
    + (Debt / Total Capital) * CoD * (1 - Tax Rate)

  CoD = Cost of Debt
  CoE = Cost of Equity
So why would you want to estimate `WACC`? `WACC` is the rate used to discount
a company's future cash flows in models like Discounted Cash Flow
(DCF) analysis and Earnings Power Value (EPV). `WACC`'s components, `Cost of Equity`
and `Cost of Debt` are also useful on their own. `Cost of Equity` is the
rate used to discount future dividends to shareholders in models like
Dividend Discount Model and Equity DCF. Bond investors can use
`Cost of Debt` to estimate the market value of a company's issued bonds.
This article with cover the steps used to estimate the
different variables described above:
- Step 1: Estimate Cost of Equity
- Step 2: Select a Tax Rate
- Step 3: Estimate Cost of Debt
- Step 4: Select Debt & Equity Weights
- Step 5: Calculate a WACC Range
I've created an Illustrative WACC model for [] to make it easy to
follow along with this guide:
Google Spreadsheet of Illustrative WACC Model
You can also build your own updated model on finbox.io here.
Estimate Cost of Equity
`Cost of equity` is the return a company needs to deliver us, its
shareholders, to compensate for the risk we undertake by investing / owning
a portion of the company.
The most commonly used method for estimating `Cost of Equity` is
grounded in the Capital Asset Pricing Model (CAPM) theory. CAPM
argues that the expected return of a security equals `Beta`
multiplied by a `Market Risk Premium` plus a `Risk-free Rate`.
(Beta * Market Risk Premium) + Risk-Free Rate
`Beta`: Measures the risk or volatility of a company's share price in
comparison to the market as a whole. For example, a company with a beta
of 1.1 will theoretically see its stock price increase by 1.1% for every
1% increase in the market. Put differently, if you're expecting the overall
market to return 8%, a stock with a beta of 1.5 should return 12%. Read more about Beta
`Market Risk Premium`: The expected market return is typically
based on the S&P 500. Read more
`Risk-free Rate`: In theory, the risk-free rate represents the expected
return of an investment that holds no risk. The yield on US treasuries
is assumed as the risk-free rate in practical application.
finbox.io makes gathering these assumptions easy by pulling in all
the key values. For Facebook, I concluded on `Cost of Equity`
between 10.5% and 11.6%.
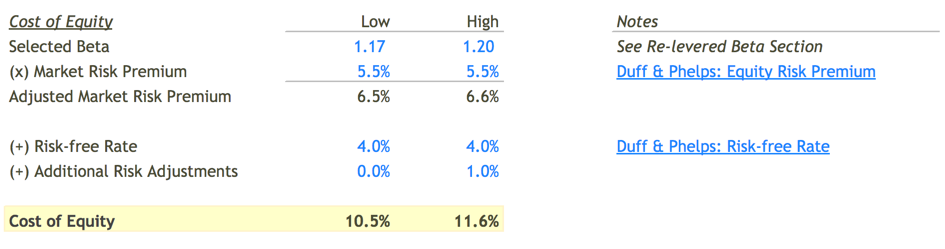
Note, this WACC model has an additional row for `Addition Risk Adjustments`
that you can use to account for the unique attributes of the subject business.
Business risk factors that justify higher `Addition Risk Adjustments`
include company size, unstable earnings, high leverage,
customer or product concentration.
Whoo! `Cost of Equity`, done!
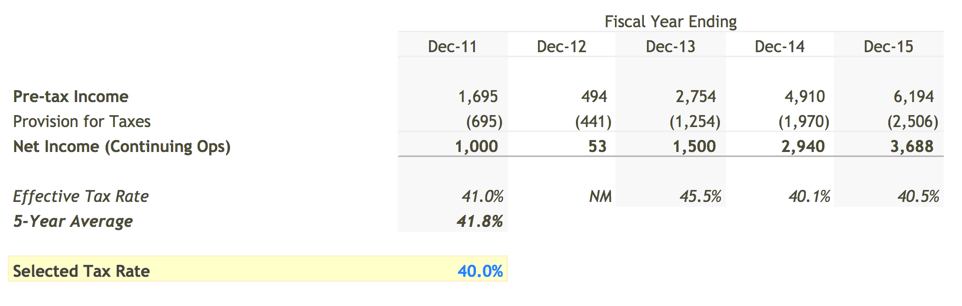
Select a Tax Rate
`Interest expense`, unlike dividends paid to shareholders, is tax deductible.
To capture the tax benefit associated with interest expense, we need to estimate
the company's tax rate.
Over the last five years, Facebook has paid around 40% of it's GAAP
income in taxes. I selected 40% which is consistent with the
historical tax rate as well as the U.S. marginal corporate tax rate
of 39.1%.
Estimate Cost of Debt
The `Cost of Debt` is the effective rate that a company pays on debt.
To estimate this cost, we first need to determine the `Pre-tax Cost of Debt`
and then use `tax rate` from the previous step to calculate the `After-tax Cost of Debt`
since interest expense is tax deductible.
To estimate `Pre-tax Cost of Debt`, we can look to these two schedules
in the finbox.io WACC model for guidance:
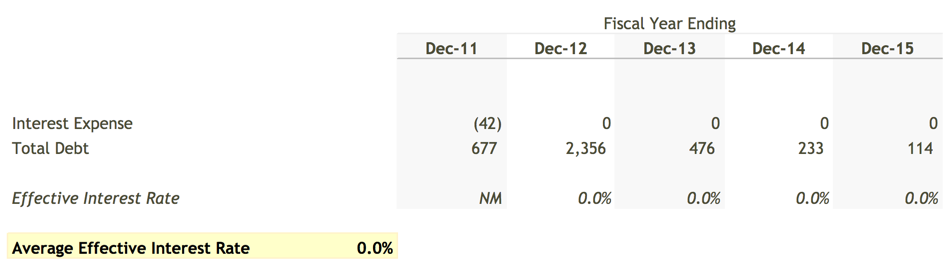
Effective Interest Rate:
The following schedule summarizes the historical `Interest Expense`
and `Total Debt`.
Synthetic Interest Rate :
In cases where effective interest rate is misleading (below
industry debt benchmarks, fluctuating wildly), it can be useful
to estimate an interest rate based on the company's operating
metrics:
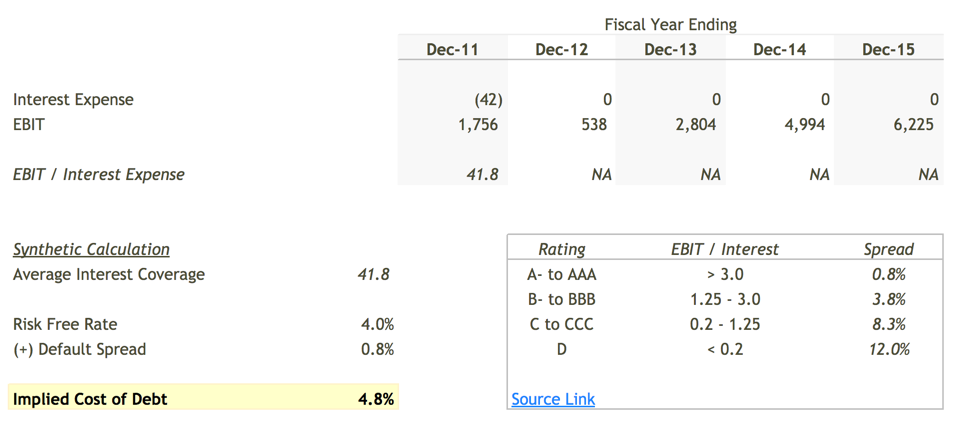
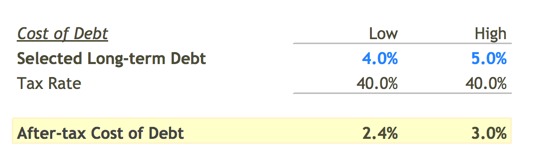
I selected a `Pre-tax Cost of Debt` of 4.0% to 5.0% which
implied an `After-tax Cost of Debt` of 2.4% to 3.0%.
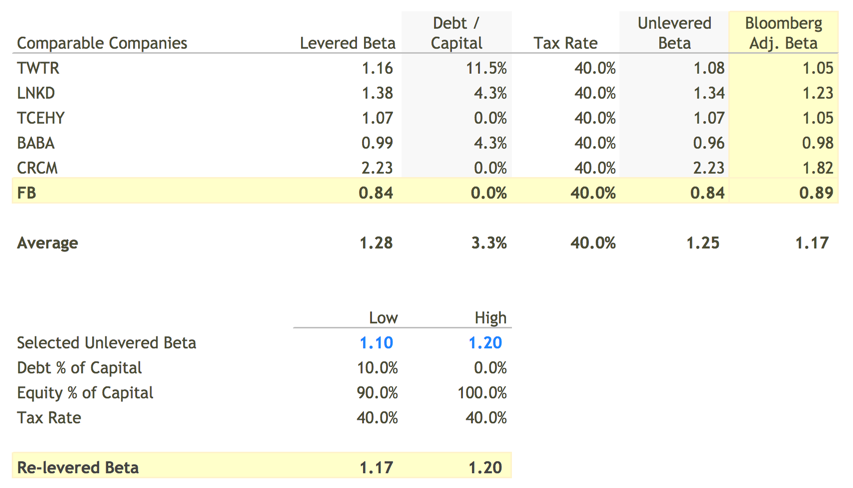
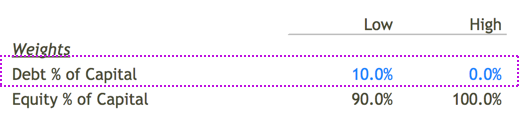
Select Debt & Equity Weights
To calculate a "weighted average", we need to determine how much of a
company's capital structure is comprised of debt versus equity. Since
capital structure fluctuates over time, it can be helpful to observe
how much debt competitors and industry peers use in their capital
structure to guide selection:
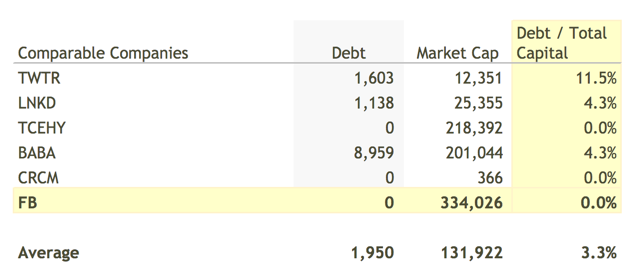
Technology companies have a tendency to avoid debt. Twitter (TWTR)
appears to have the highest amount of debt at 11.5% of `Total Capital`.
I would not be surprised if Facebook took on debt in the future to
improve shareholder returns so I selected a range of 10.0% to 0%
for `Debt to Total Capital`.
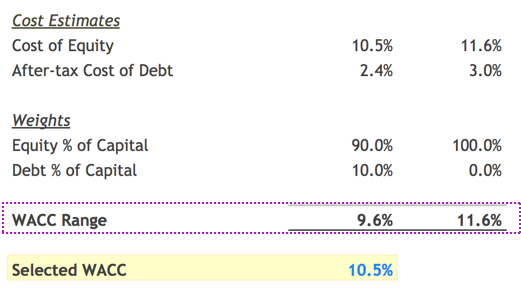
Calculate a WACC Range
Once we have all the assumptions selected, calculating a weighted average
is simple math. The assumptions I used in my model
computed a `WACC` range of 9.7% to 11.6%.
Based on this range, I selected a `WACC` of 10.5% for Facebook.
Next Steps
The weighted average cost of capital is an important assumption in
many of the models on finbox.io like Discounted Cash Flow and EPV.
You can use your estimates for `WACC` in these models. You can
also use your estimates for `Cost of Equity` in Dividend Discount Models.


%20Model)