
Multiples Valuation: EBITDA Multiples
How to Build a EBITDA Multiples Comparable Company Analysis Model
A Multiples Valuation, also known as a Comparable Companies Analysis, determines the value of a subject company by benchmarking the subject's financial performance against similar public companies (Peer Group).
We can deduce if a company is undervalued or overvalued relative to its peers by comparing metrics like growth, profit margin, and valuation multiples. finbox.io offers pre-built Multiples Valuation models based on EBITDA, Revenue, and P/E. This guide will walk through the EBITDA Multiples Valuation model.
An EBITDA Multiple, also known as Enterprise Value-to-EBITDA Multiple (EV/EBITDA), measures the dollars in Enterprise Value for each dollar of EBITDA. To determine if a company is "expensive" it's far more useful to compare EV/EBITDA multiples than the absolute stock price.
For example, let's assume Company A and Company B, are identical businesses that operate with no debt. You can purchase Company A stock for $5/share and Company B stock for $5,000/share. Company B trades at 10x EV/EBITDA and Company A trades at 50x EV/EBITDA. All else equal, Company B is "cheaper" than Company A since shareholder's receive a greater claim to earnings for each dollar invested.
The general formula behind an EBITDA Multiples model is the following:
Enterprise Value = EBITDA x Selected Multiple
Once we've estimated Enterprise Value, we can use an Equity Waterfall to get to a Fair Value per Share
Here is an outline of the process:
- Step 1: Select Comparable Companies
- Step 2: Select LTM EBITDA Multiple
- Step 3: Select Forward EBITDA Multiple
- Step 4: Conclude on a Fair Value Range
I've created an Illustrative EBITDA Multiples model for Verizon that you can use to follow along with this guide:
Google Spreadsheet of Multiples Valuation: EBITDA
You can also build your own updated model on finbox.io here.
Select Comparable Companies
Selecting a good peer group is critical in a Multiples Valuation analysis. When defining the Peer Group, it's important to understand the key characteristics of a company's operations. Good comparable companies generally operate in similar industries and have similar business models and operating metrics.
finbox.io has algorithms that select the default peer group but you can use sources like SEC filings, news, research reports, and your industry knowledge to customize the peer group.
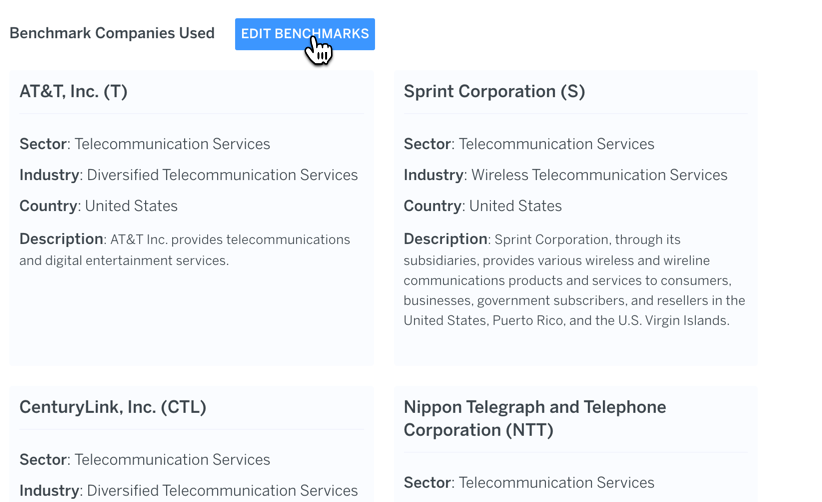
To edit the default benchmark companies used in the model:
- On the
BENCHMARKS EDITORtab, click the EDIT BENCHMARKS button
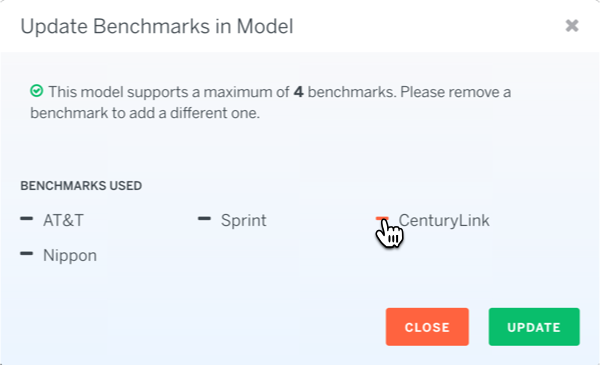
- Benchmarks are limited to 4 companies. You can remove an existing company by clicking the
--sign next to it. In my model, I wanted to replace CenturyLink with T-Mobile:
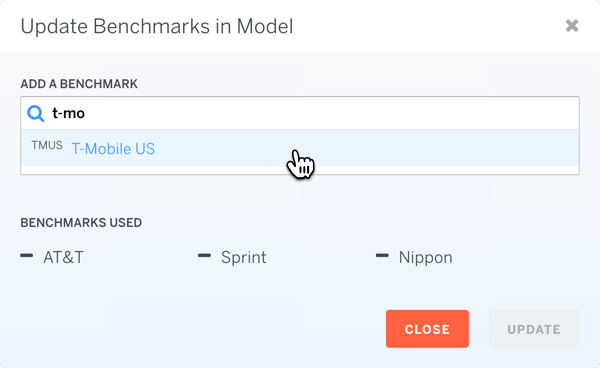
- Search for the company you would like to add:
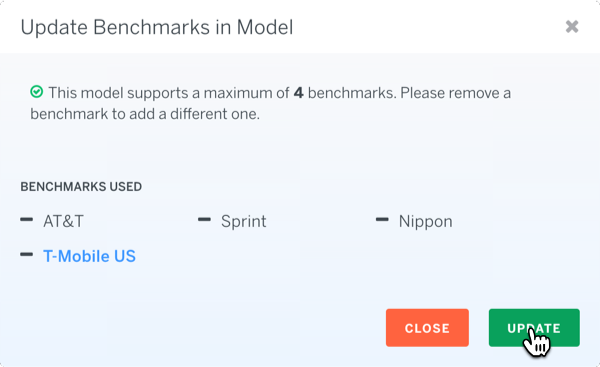
- Once you hit Update, your model will update with data for your new benchmarks
Select LTM EBITDA Multiple
The key question we're trying to answer in this step is the following -- are the differences in operating metrics like growth and margin in the peer group accurately reflected in the market EV/EBITDA multiples?
To determine whether the subject company is being valued appropriately I like to first identify the "best" and the "worst" company in the peer group. Ranking the peer group from best to worst provides me with a range of valuation multiples that I can apply to the subject company.
Some questions worth exploring during this step:
- Which company has the best historical and projected growth profile?
- Which company has the best profit margins?
- Which company is the biggest?
- Which company has the best returns on invested capital?
If all else is equal, higher quality businesses deserve higher valuation multiples. Questions like these can help you discern how the subject company ranks against the peer group. EBITDA multiples are highly correlated with growth so differences in EBITDA growth often explain differences in valuation.
The model has a table you can use to answer many of these questions:
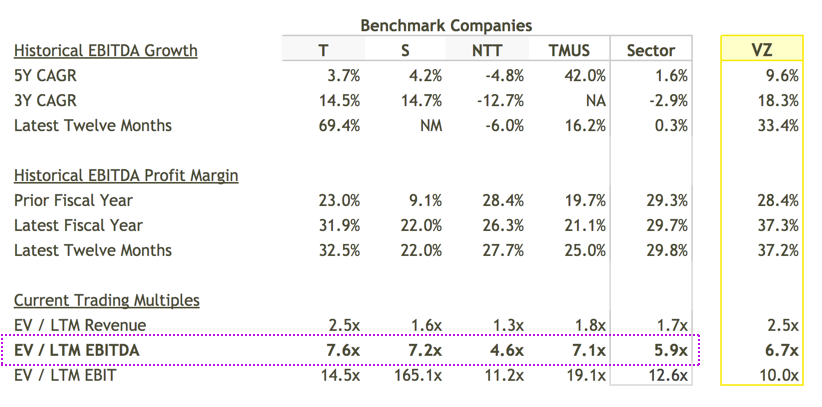
In the illustrative peer group (AT&T (T), Sprint (S), Nippon (NTT), T-Mobile (TMUS)), NTT has the lowest historical EBITDA growth and unsurprisingly trades at the lowest EV/EBITDA multiple of 4.6x. AT&T has historically delivered the best combination of EBITDA growth and EBITDA margin of 69.4% and 32.5% respectively and trades at the highest EV/EBITDA multiple of 7.6x.
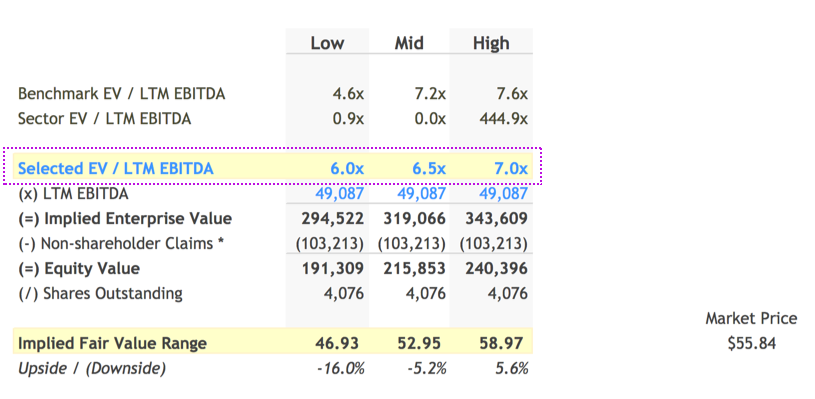
Given these data points, I'm going to value Verizon (VZ) somewhere between 6.0x to 7.0x times LTM EBITDA. This range values Verizon above the multiples for Telecom Services sector and NTT on the low-end but below AT&T, Sprint, and T-Mobile on the high-end. When I input these into my model, it yields an implied per share price range of $46.93 to $58.97, with a mid-point of $52.95.
Select Forward EBITDA Multiple
You can follow the same thought process discussed in the previous step to select a multiple based on projected or Forward EBITDA.
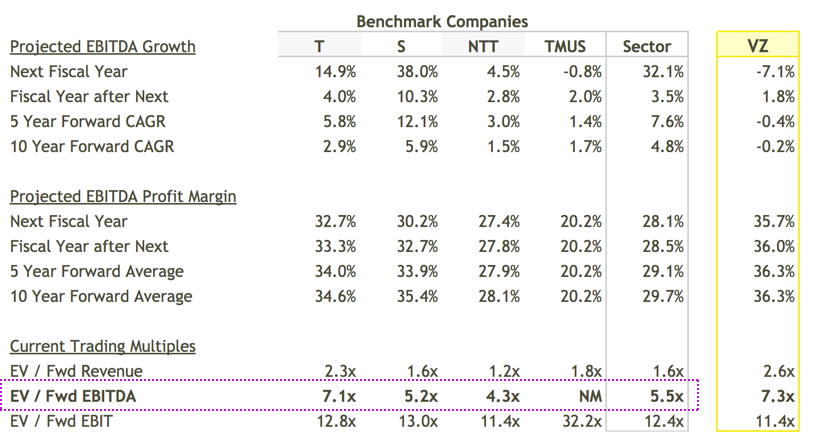
In the illustrative example, Sprint (S) has the best projected growth profile however the market seems to be heavily discounting this forecast and valuing it at 5.2x EV/Fwd EBITDA. Sprint is currently in fourth place in US market share behind Verizon, AT&T, and T-Mobile and has been discounting it's service to remain competitive (See: Sprint Loss Widens Even as It Adds Customers). This could explain the low multiple. After Sprint, AT&T once again has the best combination of growth and margin and trades at 7.1x EV/Fwd EBITDA. It's also the closest to Verizon in terms of size. NTT has the lowest multiple at 4.3x EV/Fwd EBITDA.
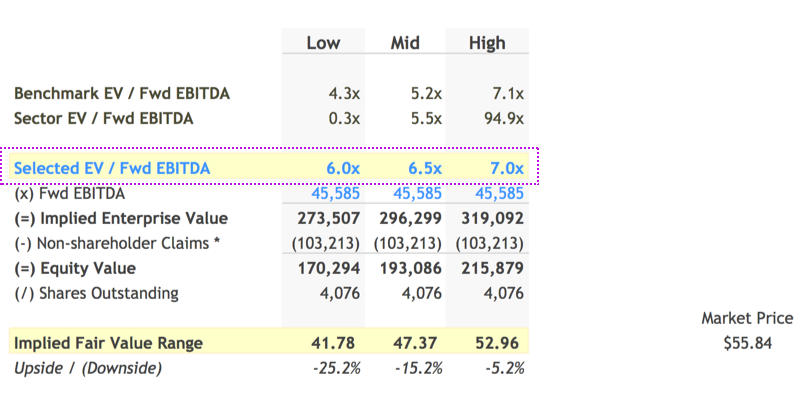
Based on the range of multiples described above I selected a Fwd EBITDA multiple range of 6.0x to 7.0x, above S, NTT, and the Sector median on the low-end and below AT&T on the high-end. Inputting these into the model, implies a Fair Value per Share range of $41.78 to $52.96, with a mid-point of $47.37.
Conclude on a Fair Value Range
Based on the range of fair values detemined using LTM and Forward EBITDA, in this step you can input your concluded Fair Value Range and see how it compares to the current market price. By default finbox.io uses a simple average of the two estimates.
In my model, I felt more confident in my LTM EBITDA multiple selection, so I selected a concluded fair value range that's more in line with LTM Selections.
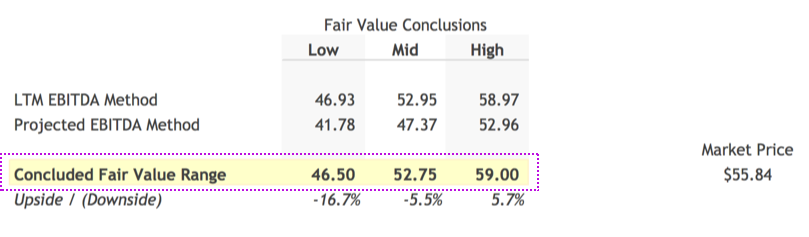
Based on my EBITDA multiples analysis, Verizon currently appears to fairly valued by the market. I personally like investing in companies that offer at least a 25% discount to my Fair Value estimate which in Verizon's case would be ~$39.50/share. Verizon's 52-Week Low is $38.06. If it were to get back to those level's again, I would love to take another look. Luckily, finbox.io's Price Target and Alerts features are great for tracking these types of movements!
Next Steps
Multiples Valuation models are useful in getting a sense of an industry quickly. Has the industry experienced a downturn recently? Is it on the upswing? How optimistic are analysts on the industry's prospects? What range of valuation multiples does the market assign to companies in this space?
You can answer many of these questions with a quick glance at the numbers. Then with a few assumptions, you can determine if a company justifies further research. Pretty awesome! Since no one valuation approach is perfect, we recommend using a combination of models to get a sense for the risks involved and triangulate a fair value before making an investment.

