Discounted Cash Flow: Revenue Exit Method
How to Build a Discounted Cash Flow Model: Revenue Exit Method
Discounted Cash Flow (DCF) analysis is a generic method for of valuing a project, company, or asset. A DCF forecasts cash flows and discounts them using a cost of capital to estimate their value today (present value). DCF analysis is widely used across industries ranging from law to real-estate and of course investment finance.
Note: If you've read our guides on DCF: Growth Exit Method or DCF: EBITDA Exit Method already, you can skip ahead to the Terminal Value section as you may find other sections of this guide repetitive.
Here is the general formula behind DCF models:
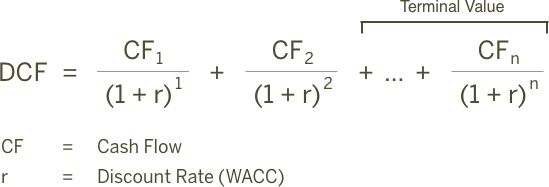
Since we can't keep projecting cash flows forever, most DCF models forecast cash flows individually for five or ten years and then estimate a continuing value or Terminal Value. Terminal value represents the future value of a company beyond the projection period.
Depending on the length of the projection period, it is not uncommon for the Terminal Value to represent 75% or more of the company's total value. Since Terminal Value is a critical assumption, finbox.com offers three options for estimating the value: Gordon Growth approach, EBITDA Multiple and Revenue Multiple.
This guide will walk through a DCF analysis for Facebook that uses a Revenue Multiple to estimate Terminal Value.
Here is an outline of the process:
-
Step 1: Forecast Free Cash Flows
- Create a Revenue Forecast
- Forecast EBITDA Profit Margin
- Forecast Depreciation & Amortization Expenses
- Select a Pro Forma Tax Rate
- Plan Capital Expenditures
- Forecast Net Working Capital Investment
- Calculate Free Cash Flow
-
Step 2: Select a Discount Rate
-
Step 3: Estimate a Terminal Value
-
Step 4: Calculate The Equity Waterfall
I've created an Illustrative DCF Model for Facebook that you can use to follow along with this guide:
Illustrative DCF: Revenue Exit Method
You can also build your own updated model on finbox.com here.
Forecast Free Cash Flows
The philosophy behind a DCF analysis argues the value of a company is equal to the expected future cash flows of that company. Since future free cash flows can be difficult to estimate directly, the model helps us build up to them. The model starts at the top of the Income Statement by creating a forecast for Revenue and then works it's down to Net Operating Profit After Tax (NOPAT).
Here is the formula for calculating NOPAT:
  Revenue
      (-) Operating Expenses
  (=) EBIT
      (-) Taxes
  (=) NOPAT
The model then deducts cash outflows like Capital Expenditures (CapEx) and Investment in Net Working Capital and adds back non-cash expenses from the Income Statement like Depreciation and Amortization (D&A) to calculate the free cash flow forecast:
  NOPAT
      (-) Capital Expenditures
      (-) Investment in Net Working Capital
      (+) Depreciation and Amortization
  (=) Unlevered Free Cash Flow
Create a Revenue Forecast
When available, finbox.com uses analyst forecasts for Revenue as the starting assumptions in a model. To forecast Revenue, analysts gather data about the company, it's customers and the state of the industry. I typically review the analyst forecast and modify the growth rates based on historical performance, news, and other insights I've gathered.
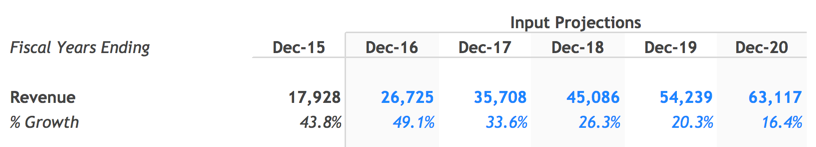
Here is the formula the model uses to create a Revenue forecast:
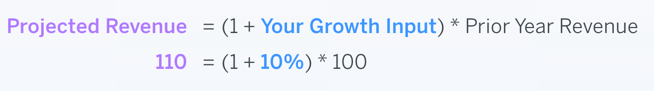
Here's the Revenue forecast I used in my model:
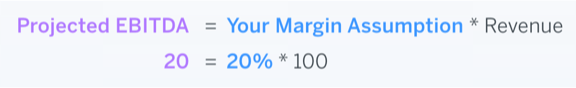
Forecast EBITDA Profit Margin
How much of the revenue Facebook generates will the company convert into profit? The model uses EBITDA as a proxy for profit at this step and deducts Taxes, Depreciation & Amortization expenses separately later in the model.
Here is the formula the model uses to calculate the EBITDA forecast:
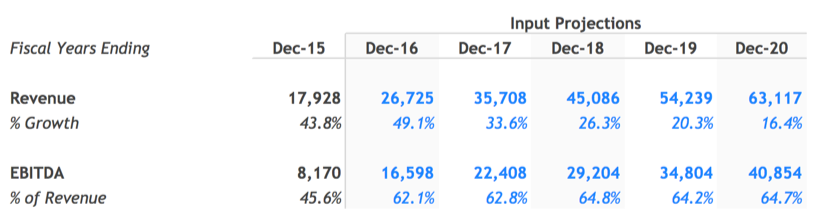
This is the forecast I used in my model:
Forecast Depreciation & Amortization Expenses
Depreciation and amortization are usually part of Cost of Goods Sold (COGS) or Selling General & Administrative Expenses (SG&A). Since it's a non-cash expense the model runs the D&A forecast to estimate NOPAT but adds it back in the build-up to free cash flow. Including it in the NOPAT build allows the model to capture tax benefits associated with D&A. To avoid double counting the outlay's associated with capital expenditures, the model deducts the actual capital expenditures forecast and adds back D&A.
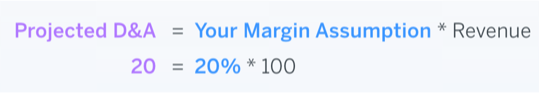
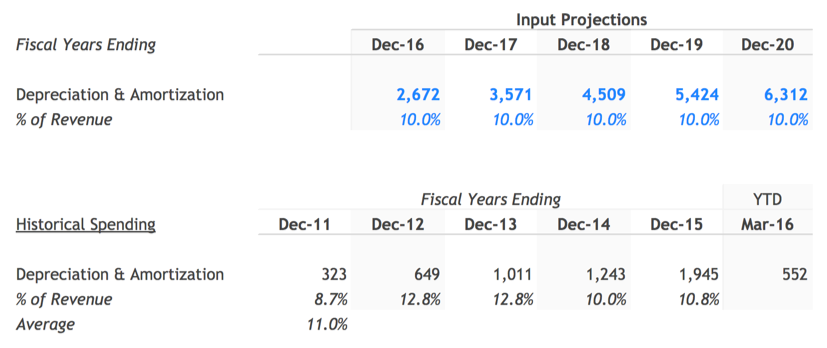
Here's the D&A forecast I used in my model:
Select a Pro Forma Tax Rate
"In this world nothing can be said to be certain, except death and taxes."**- Benjamin Franklin**
Companies are required to pay a portion of profits to the governments in the countries they operate. Historical effective tax rates are useful for estimating a company's marginal tax rate:
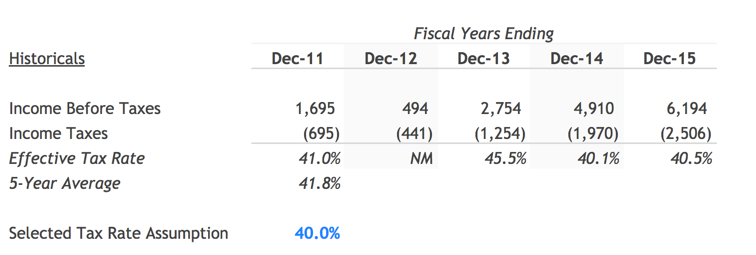
Over the last five years, Facebook has paid 41.8% of it's GAAP income in taxes. This inline with the 39.1% U.S. marginal corporate tax rate. I assumed a 40% tax rate in my model.
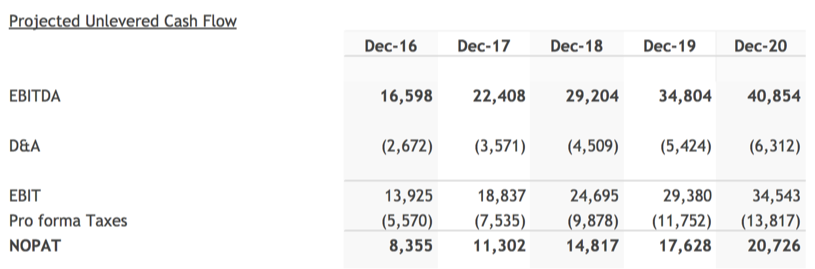
The model uses the forecasts created so far to calculate the NOPAT forecast. You can see the build to NOPAT in the Calculation of Free Cash Flow section of the model:
Plan Capital Expenditures
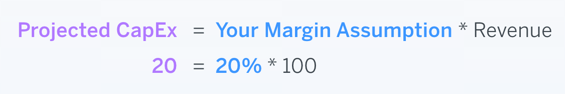
Spending on plant, property, and equipment allow Facebook to operate and grow. Here is the formula the model uses to forecast Capital Expenditures (CapEx):
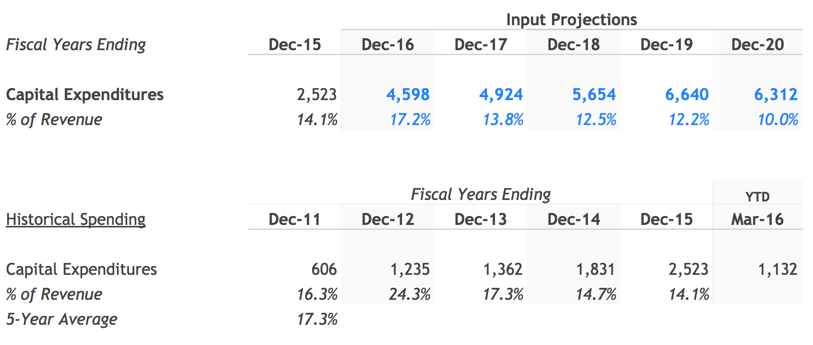
Facebook has spent 17.3% of revenue the last five years on Capital Expenditures on average. I assumed spending would normalize to 10.0% of revenue by 2020 once it's growth efforts catch up with revenue:
Forecast Net Working Capital Investment
As a company grows, it typically needs to tie up more cash in working capital to manage the day to day operations effectively. The model accounts for the impact of this investment on free cash flow by first estimating Net Working Capital as a % of revenue and then deducting year over year increases from free cash flow:
Here are the formulas used to forecast investment in Net Working Capital:
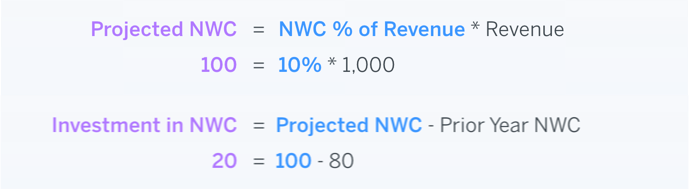
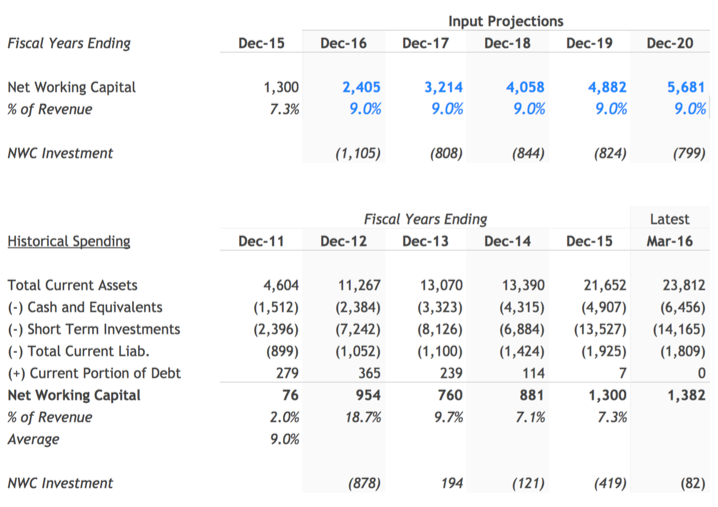
Facebook has on average required 9.0% of revenue historically for net working capital. I assumed Facebook would maintain 9.0% of revenue for Net Working Capital going forward:
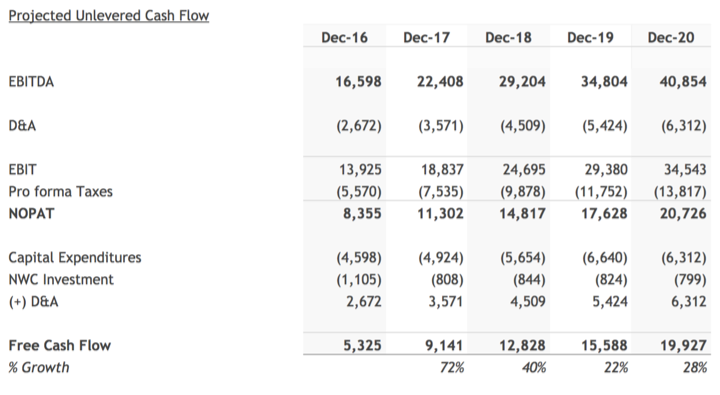
Calculate Free Cash Flow
With all required forecasts in place, calculating projected free cash flow is simple:
Select a Discount Rate
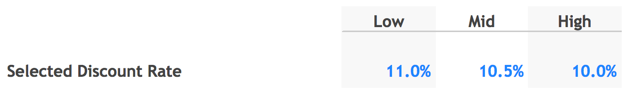
Next, we need a discount rate to calculate the present value of the forecasted free cash flows. finbox.com has a Cost of Capital that you can use to arrive at your own estimate for Cost of Capital.
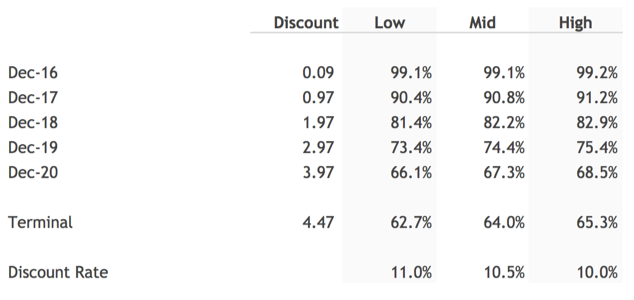
I determined a reasonable WACC estimate for Facebook to be between 10.0% and 11.0%. You can read about the build-up here.
The model does the heavily lifting of calculating the Discount Factors using the mid-year convention. You can follow the methodology used to by reviewing the a) Discounting Periods and b) Discounting Factors.
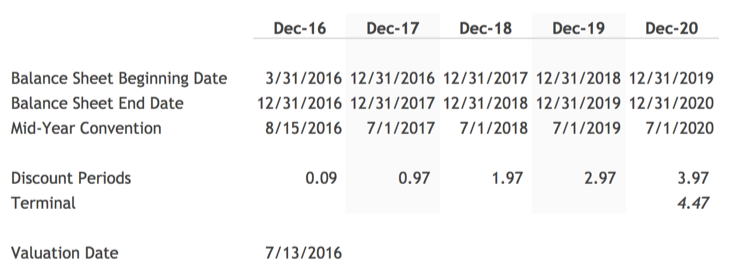
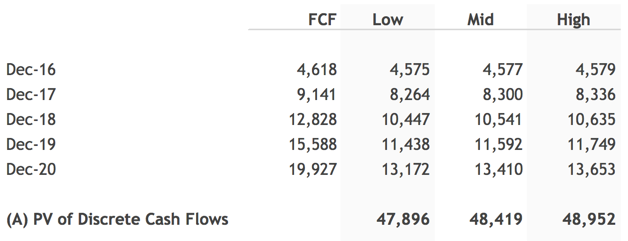
Applying the Discounting Factors however is simple. For example, to calculate the present value of December 2020 projected cash flow, we can multiply Facebook cash flow that year, $19,927, by the matching discount factor.

The model follows a similar process to compute the present value for each of the projected cash flows:
Estimate a Terminal Value
As mentioned earlier, this variation of the DCF uses an
Revenue Exit Multiple to estimate Terminal Value.
An Revenue Multiple or EV/Revenue multiple is defined as:
Revenue Multiple = Enterprise Value / Revenue
Current trading multiples are a great basis for selecting a the Terminal Mulitple. The Current Trading Multiples section of the model presents useful information on current EV/Revenue multiples for companies similar to Facebook:
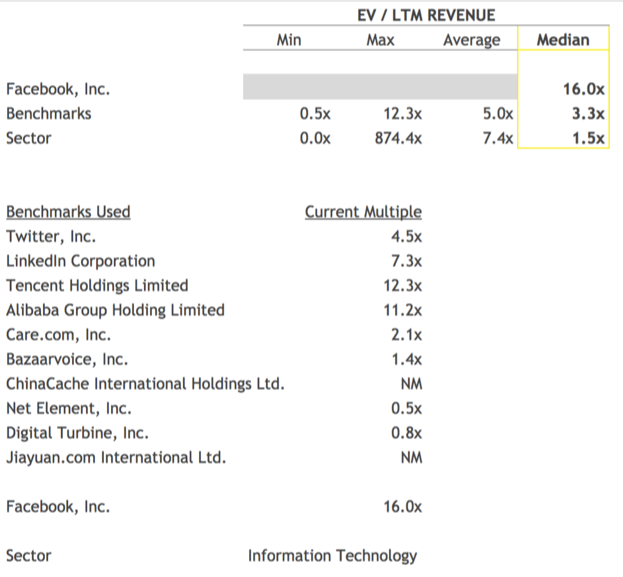
By default, finbox.com uses an average of a) Facebook's current EV/Revenue multiple, a) the median multiple for Facebook's benchmark companies, and the median multiple for the Sector. In the Facebook's model, this comes out to 6.9x. Comparing the Terminal Value implied by selected Revenue Exit multiple to other approaches for estimating Terminal Value can serve as a useful sanity check. For instance, if I used all the same assumptions in a DCF: EBITDA Exit model but selected a 9.3x EBITDA Exit Multiple to calculate Terminal Value, I would arrive at the same Fair Value. Weighing these factors, I used 6.0x EV/Revenue exit multiple in my model:
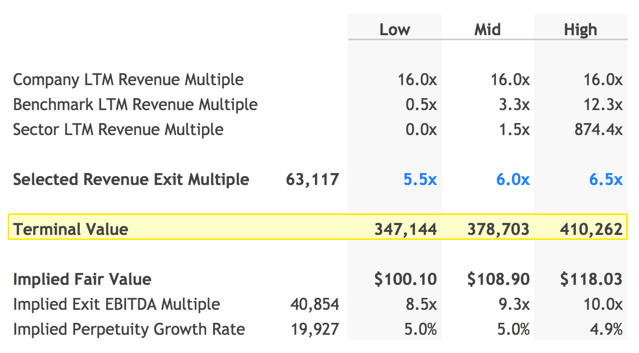
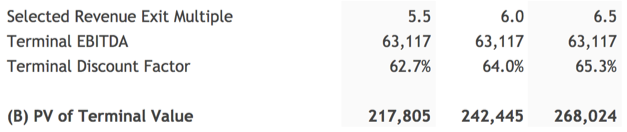
The Terminal Value calculated above is the value in the future. We can use the Terminal Discount Factor to compute the present value:
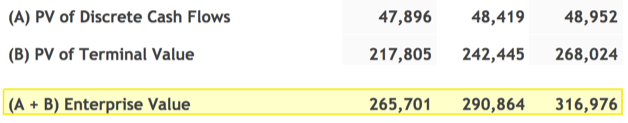
The model then adds the PV of Discrete Cash Flows and PV of Terminal Value together to calculate Enterprise Value:
Calculate The Equity Waterfall
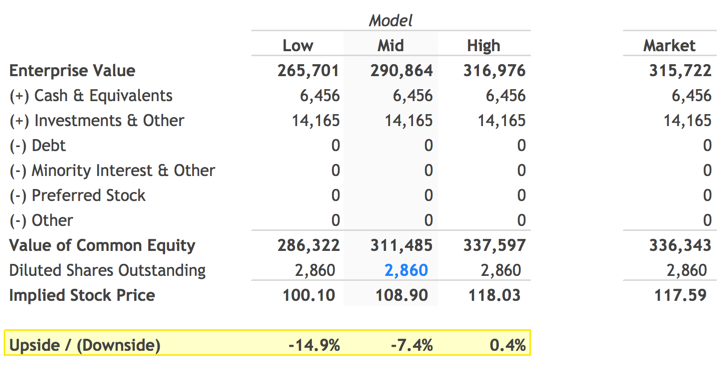
An Equity Waterfall, aka Equity Value Bridge, refers to the steps used to get from the Enterprise Value of a company to its aggregate Equity Value or Market Cap.
Here is the formula for calculating an Equity Waterfall:
Enterprise Value
  (-) Total Debt
  (-) Minority Interest and Other Liabilities
  (-) Preferred Equity
  (-) Pension
  (+) Cash and Short Term Investments
   = Equity Value / Market Cap
The model uses the formula above to calculate Equity Value and divides the result by the Shares Outstanding to compute Fair Value per Share.
Nice!
The assumptions I used in my model implied a range for Fair Value per Share for Facebook of **$100.10 ** to *$118.03. At the time of this writing, Facebook's currently trading at $117.59, ~8% above the mid-point Fair Value of $108.90. Facebook's 52-Week Low is $72.00. At $72.00, Facebook would be trading at ~33% discount to my ~$108.90 computed Fair Value. finbox.com's Price Target and Alerts features are great for tracking pull-backs in stock price, so when a good entry point comes around, you're ready to take the plunge!
Next Steps
The DCF model can seem complex as first but it's worth adding to your investment analysis toolbox since it provides the clearest view on value of a company.
"It is better to be roughly right than precisely wrong"**- John Maynard Keynes**
Instead of focusing on the getting each of the assumptions exactly right, take Keynes' advice on being roughly right. Select different reasonable assumptions to get a sense for key drivers of value. You can save different scenarios (e.g. Base Case, Downside Case etc.) to get comfortable the upside and downside potential of the company. As with all models on finbox.com, I recommend using a combination of models to get a sense for the risk involved and triangulate a fair value.
Sources / Further Reading:
- Working With Financial Models
- Investopedia: What is a Discounted Cash Flow (DCF)?
- Definition of Gordon Growth
- Definition of Revenue Multiple
- Definition of EBITDA Multiple
- Definition of Enterprise Value
- Definition of Equity Waterfall
- Compound Annual Growth Rate
- WACC Model
- Video on Discount Factors and NPV
- Mid Year Convention
- Discounted Cash Flow: Growth Exit Method
- Discounted Cash Flow: EBITDA Exit Method

